Overview
Use System Health to review high-level appliance and collector health from Activity Monitor. The tab summarizes appliance CPU, memory, and I/O wait, then shows collector storage footprint and collection pipeline activity.
Typical Uses
Common tasks include:
- Check whether the appliance is under CPU, memory, or I/O pressure.
- Review collector storage footprint.
- Check whether collector ingest or write-back is falling behind.
- Compare system activity across a recent or custom time range.
- Decide whether to open Metric Browser for deeper metric inspection.
Prerequisites
- Log in with an account that can view system activity and metrics.
- Confirm the time range needed for the investigation.
- Use shorter ranges such as Last 1H for live troubleshooting.
- Use Custom when matching a known event window.
- Remember that System Health is a summary view. Use Metric Browser for detailed metric selection and plotting.
Workflow
- Open Activity Monitor.
- Select System Health.
- Choose a time range: Last 1H, Last 6H, Last 24H, Last 7D, or Custom.
- Review Appliance Activity.
- Review Collection Footprint.
- Review Collection Pipeline Health.
Expected Behavior
System Health displays a compact health overview rather than a detailed metric catalog. The selected time range applies to Appliance Activity and Collection Pipeline Health charts.
The page shows a refresh control for relative time ranges so the selected window can be moved to the current time. A custom range stays fixed until the operator changes it.
If collector summary data is loading or unavailable, the page displays loading or error text instead of silently hiding the affected section.
Procedure
Open System Health
- Open Activity Monitor.
- Select the System Health tab.
- Wait for the activity charts and collector summary to load.
Choose A Time Range
Use the range buttons in Appliance Activity:
- Click Last 1H, Last 6H, Last 24H, or Last 7D.
- Review the Time Range display.
- Click the refresh control when using a relative range and you want the range to end at the current time.
Use Custom for an exact range:
- Click Custom.
- Choose Start Time and End Time.
- Use quick-adjust buttons if a fixed interval from one endpoint is needed.
- Click Apply Range.
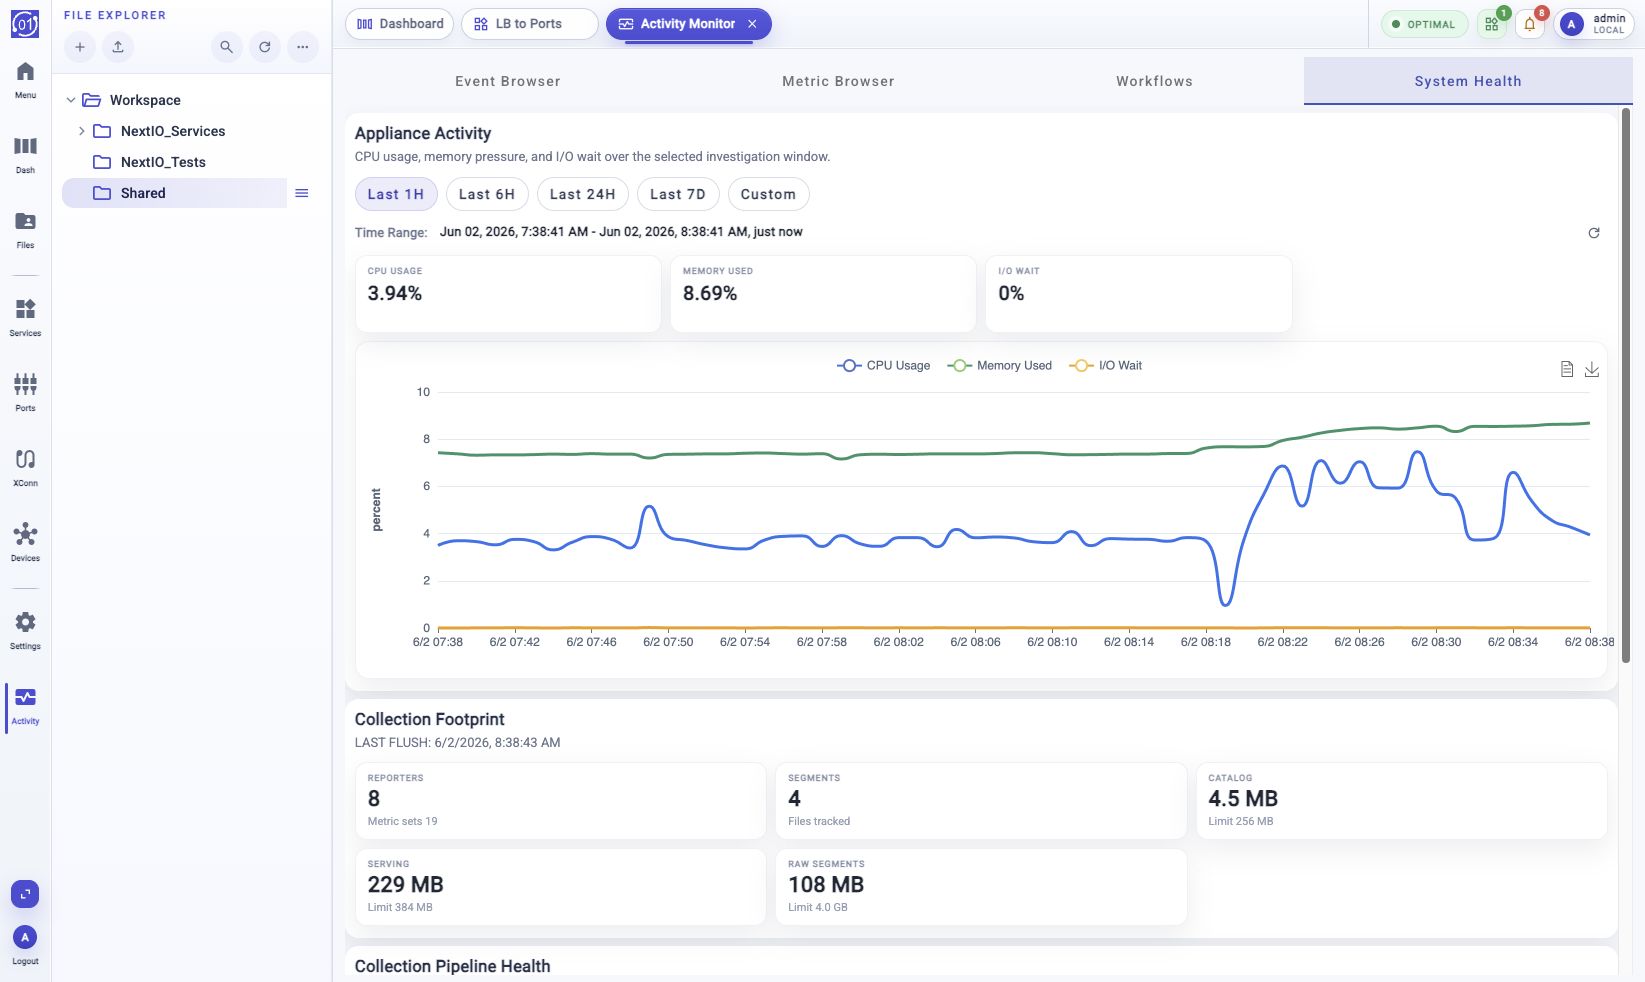
Review Appliance Activity
The Appliance Activity panel shows:
- CPU Usage
- Memory Used
- I/O Wait
- A chart for the selected investigation window
Use this panel to identify broad appliance pressure. If a value looks abnormal, open Metric Browser and inspect the related process or host metric in more detail.
Review Collection Footprint
The Collection Footprint panel summarizes collector inventory and storage. It includes the latest flush time and storage cards for:
- Reporters
- Segments
- Catalog
- Serving
- Raw Segments
Use this panel to check whether collector storage is growing as expected and whether storage usage is approaching configured limits.
Review Collection Pipeline Health
The Collection Pipeline Health panel shows collector ingest and write-back activity for the selected time range:
- Rate Append Rows
- Rate Write Rows
- Current Ingest Queue Length
- A chart for pipeline activity
Use this panel to determine whether data is arriving, being written, or backing up in the ingest queue.
Field Reference
| Element | Description |
|---|---|
| Last 1H | Show activity for the last one hour. |
| Last 6H | Show activity for the last six hours. |
| Last 24H | Show activity for the last 24 hours. |
| Last 7D | Show activity for the last seven days. |
| Custom | Select an exact activity window. |
| Time Range | Displays the resolved range used by activity charts. |
| CPU Usage | Latest CPU usage value in the selected range. |
| Memory Used | Latest memory usage value in the selected range. |
| I/O Wait | Latest I/O wait value in the selected range. |
| Reporters | Number of reporter identities known to the collector. |
| Segments | Number of tracked collector segment files. |
| Catalog | Collector catalog database size and limit. |
| Serving | Collector serving database size and limit. |
| Raw Segments | Raw segment storage size and limit. |
| Rate Append Rows | Latest collector append row rate. |
| Rate Write Rows | Latest collector write row rate. |
| Current Ingest Queue Length | Latest collector ingest queue depth. |
Notes
- System Health is read-only.
- The selected time range controls charts, not retained collector inventory counts.
- Relative time ranges are resolved when selected. Use refresh to move the range to now.
- If a chart is empty, the selected range may not contain samples for that metric.
- Use Metric Browser for lower-level component metrics and multi-line comparisons.
Troubleshooting
Activity Chart Is Empty
Choose a wider time range and refresh the view. If the chart is still empty, open Metric Browser and check whether the related reporter has current samples.
Collector Footprint Is Missing
Wait for collector summary loading to complete. If the section remains unavailable, check Event Browser for collector or metric-store errors.
Ingest Queue Keeps Growing
Open Metric Browser for collector metrics and check write rates, queue depth, storage activity, and process health over the same time range.
Related Tasks
- Use Event Browser to inspect collector warnings or errors.
- Use Metric Browser to inspect detailed process and collector metrics.
- Use Workflows when a health issue appears during or after a workflow run.