Overview
Use Metric Browser to inspect runtime and collector metrics from the web UI. The page provides a searchable metric tree, process health summary cards, time-series charts, a multi-line plotter, and read-only access to collector warehouse metadata and preview rows.
Typical Uses
Common tasks include:
- Check current health for key 01Layer processes.
- Review CPU, memory, file descriptor, or collection pipeline activity.
- Search for a metric by component, metric set, metric name, or warehouse table.
- Inspect a single sampled metric over a selected time range.
- Compare several metrics in one chart.
- Review collector database tables, views, schemas, preview rows, or segment files.
Prerequisites
- Log in with an account that can view system events and metrics.
- Confirm the time window you need before comparing charts.
- Use a recent relative range such as Last 1H for live troubleshooting.
- Use Custom when you need an exact start and end time.
- Remember that metric trees are loaded on demand. Expand a component branch before expecting its metric names to appear in search results.
Workflow
- Open Activity Monitor.
- Select Metric Browser.
- Select Summary, 01Layer Component Catalogs, or Data Warehouse in the left tree.
- Choose a time range when viewing charts.
- Select a metric node to load its summary and chart.
- Use Multi-Line Plotter when comparing multiple metrics.
Expected Behavior
Metric Browser is a read-only inspection view. Selecting tree nodes loads the matching summary, metric chart, schema, preview rows, or storage details in the right panel. Relative time ranges end at the current refresh time. The refresh button updates the selected relative window to now.
The left tree is organized around three main areas:
- Summary for key appliance process health and activity charts.
- 01Layer Component Catalogs for sampled metrics organized by reporter, entity, object, metric set, and metric.
- Data Warehouse for collector-owned catalog, serving, and segment storage.
Procedure
Open Metric Browser
- Open Activity Monitor.
- Select the Metric Browser tab.
- Wait for the metric tree and summary panel to load.
The Search Metric Browser field filters visible tree entries by component, metric, or warehouse table. Use the expand/collapse icon in the tree toolbar to open or close loaded branches.
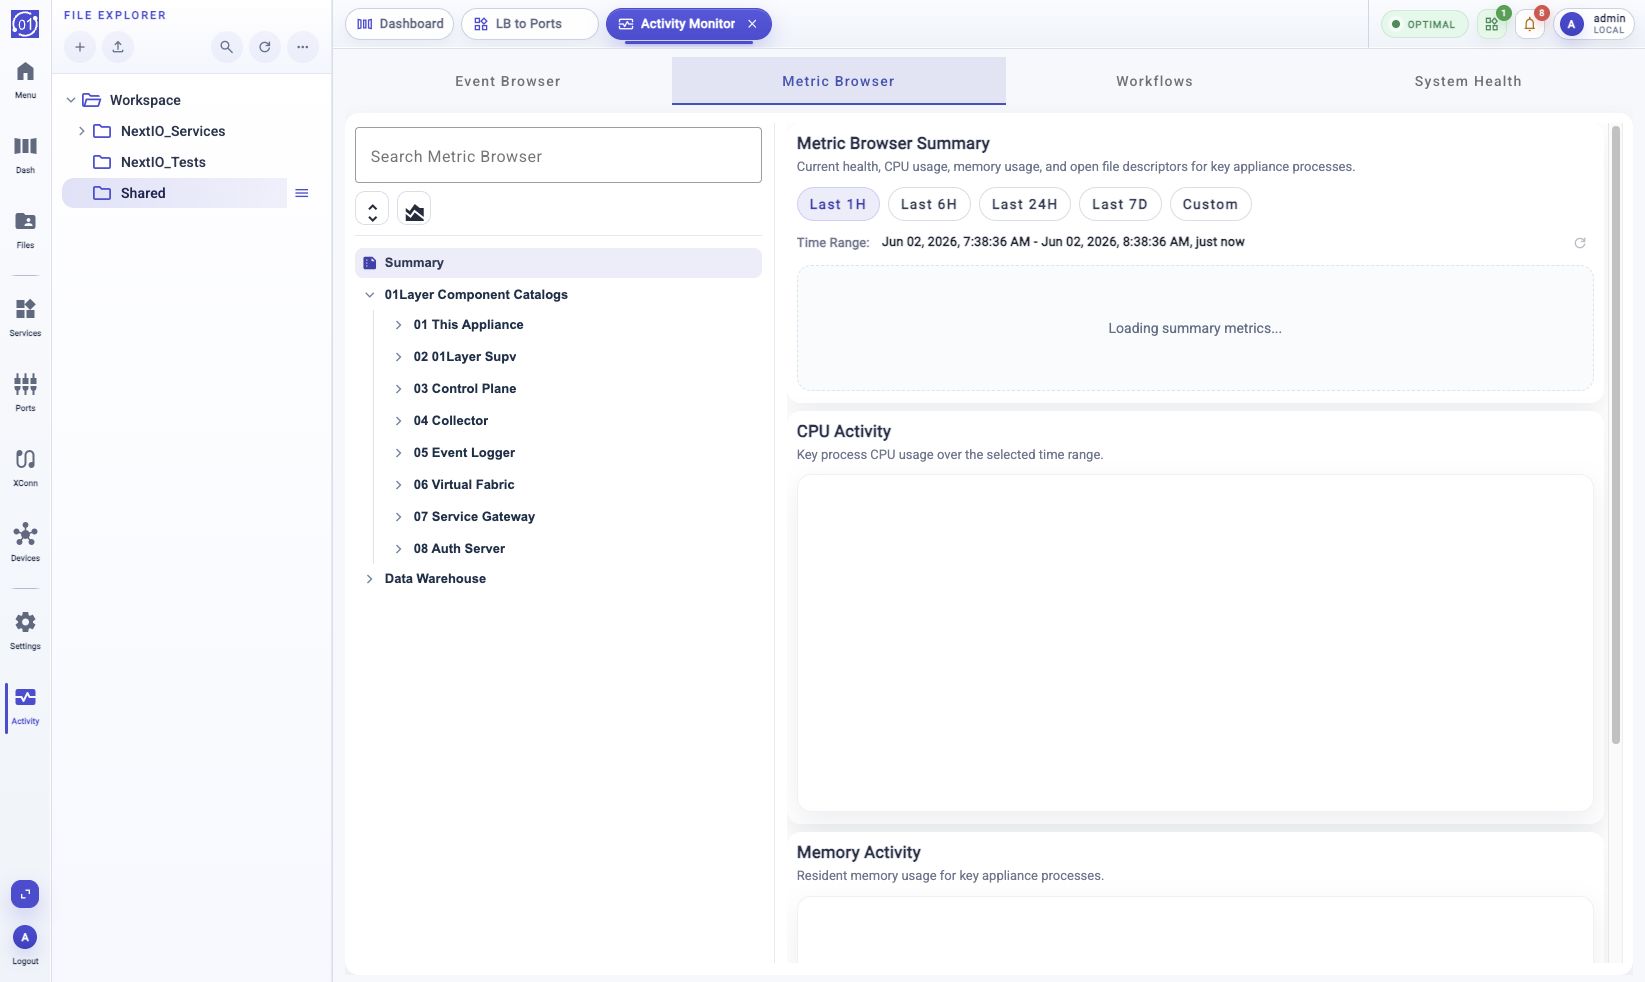
Use Summary
- Select Summary in the left tree.
- Choose a time range: Last 1H, Last 6H, Last 24H, Last 7D, or Custom.
- Review the Metric Browser Summary cards.
- Review CPU Activity and Memory Activity charts.
Summary cards show the current state for key appliance processes, including CPU, memory, open file descriptors, PID, and last sample time.
Choose A Time Range
For relative time ranges:
- Click Last 1H, Last 6H, Last 24H, or Last 7D.
- Review the Time Range display.
- Click the refresh icon when you want the window to end at the current time.
For an exact time range:
- Click Custom.
- Choose Start Time and End Time.
- Use quick-adjust buttons when you need to move an endpoint by a fixed interval.
- Click Apply Range.
Inspect A Component Metric
- Expand 01Layer Component Catalogs.
- Expand a component, such as This Appliance, Control Plane, Collector, Event Logger, Service Gateway, or Auth Server.
- Expand entity, object, metric set, and metric groups as needed.
- Select a metric leaf.
- Review Metric Summary - Reporters Current and the chart.
The metric summary shows the reporter, identity, metric set, metric name, source column, unit, data interval, chart value, point count, and latest value when available.
Compare Metrics
Use Multi-Line Plotter to compare several metrics in one chart.
- Click the Multi-Line Plotter icon in the Metric Browser tree toolbar.
- Choose a time range.
- Select Line chart or Stacked area chart from Plot Style.
- Use Search Metrics to filter metric names or components.
- Expand 01Layer Component Catalogs and select one or more metric checkboxes.
- Review the combined chart.
- Use Clear Selection to remove all selected metrics.
- Click Close when finished.
Search in the plotter applies to loaded branches. Expand component branches to load more metric names into the search scope.
Inspect Data Warehouse
Use Data Warehouse when you need collector storage details.
- Expand Data Warehouse.
- Select Catalog Database, Serving Database, or Data Segments.
- Expand tables or views to inspect object names and columns.
- Select a table or view to load schema and preview rows.
- Use Previous and Next to page through preview rows when available.
The warehouse view is read-only. It is intended for troubleshooting collector storage, schema, and segment state, not for editing data.
Field Reference
| Element | Description |
|---|---|
| Search Metric Browser | Filter components, metrics, or warehouse tables in the left tree. |
| Expand/collapse icon | Expand or collapse loaded Metric Browser tree nodes. |
| Multi-Line Plotter | Open a dialog for plotting multiple sampled metrics in one chart. |
| Summary | Show process health cards and process CPU/memory activity charts. |
| 01Layer Component Catalogs | Browse sampled metrics by reporter, entity, object, metric set, and metric. |
| Data Warehouse | Inspect collector catalog, serving, and segment storage. |
| Last 1H | Chart the last one hour. |
| Last 6H | Chart the last six hours. |
| Last 24H | Chart the last 24 hours. |
| Last 7D | Chart the last seven days. |
| Custom | Select an exact start and end time. |
| Apply Range | Apply a custom time range. |
| Refresh to now | Recalculate a relative time range so it ends at the current time. |
| Metric Set | The logical metric collection selected from the catalog. |
| Metric | The selected sampled metric. |
| Column | The underlying source column used for the selected chart value. |
| Unit | The display unit for the selected metric when one is defined. |
| Data Interval | The chart bucket interval used for the selected time range. |
| Points | Number of plotted points returned for the selected metric. |
| Last Value | Latest value in the returned series. |
| Plot Style | Choose line chart or stacked area chart in Multi-Line Plotter. |
| Clear Selection | Remove all selected metrics from Multi-Line Plotter. |
Notes
- Metric data is sampled. A missing point does not always mean a process was down; it may mean no sample was available in the selected bucket.
- Relative time ranges are resolved when the chart is loaded. Refresh the range when you need the latest data.
- Custom time ranges are fixed until changed.
- The component catalog is loaded lazily. Expand branches to load child metric sets and metrics.
- The Data Warehouse section is read-only and may display only preview rows, not full table contents.
- Some metric branches may show that a reporter is registered but has no sampled entities yet.
Troubleshooting
Metric Tree Is Empty
Wait for the collector services to finish loading. If the tree stays empty, clear the search field and refresh the page. Confirm that the collector service is running.
Search Does Not Find A Metric
Expand the relevant component branch first. Metric search applies to currently loaded branches, so unloaded child nodes may not match until their parent is opened.
Chart Is Empty
Choose a wider time range such as Last 24H or Last 7D. If the chart is still empty, the selected metric may not have samples in the chosen interval.
Custom Range Cannot Be Applied
Verify that both Start Time and End Time are set and that the start time is earlier than the end time.
Latest Value Looks Stale
Use the refresh icon for relative time ranges. For custom ranges, update the start and end times manually.
Data Warehouse Preview Is Empty
The selected table, view, or segment may have no preview rows. Select another object, widen the metric context, or confirm that collector data is being written.
Related Tasks
- Use Activity Monitor > Event Browser to correlate metrics with warning, error, or critical events.
- Use Dashboard to check high-level appliance status before drilling into metric details.
- Use service or system workflows to resolve the condition indicated by a metric trend.