Overview
Activity Monitor is the Web UI investigation workspace. Use it when you need to review events, inspect metrics, audit workflow runs, or check appliance and collector health.
The page is organized into four tabs:
| Tab | Use it when you need to |
|---|---|
| Event Browser | Review event logs, alert severity, attention state, and event details. |
| Metric Browser | Browse sampled metrics, chart metric history, compare metrics, or inspect collector warehouse data. |
| Workflows | Audit workflow runs, find failed operations, and inspect stored input or trace output. |
| System Health | Check appliance activity, collector footprint, and collection pipeline health. |
Open From Activity Bar
Click Activity Monitor in the activity bar. In expanded mode, it appears below System Settings and above Logout. In folded mode, use the same position in the icon column.
You can also open Activity Monitor from Start Menu, from System Settings, or from dashboard drill-downs such as alerts, events, workflows, or metrics.
Event Browser
Use Event Browser when the question starts with an alert, warning, error, or event message.
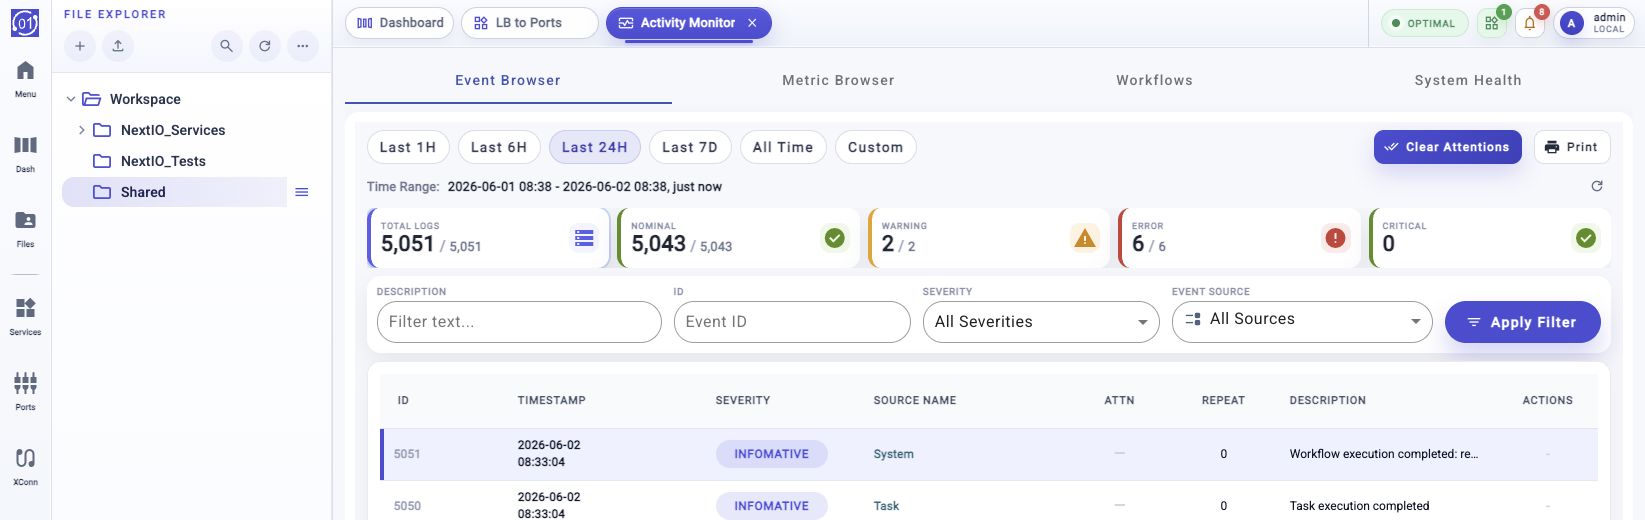
The tab provides time ranges, severity summary cards, filter controls, an event table, row actions, and an event detail panel.
| Area | What to inspect |
|---|---|
| Time range | Choose Last 1H, Last 6H, Last 24H, Last 7D, All Time, or Custom. Use All Time when comparing with retained dashboard alert counts. |
| Summary cards | Review Total Logs, Nominal, Warning, Error, and Critical counts. Click a card to filter by severity. |
| Filters | Narrow rows by description, event ID, severity, or source. |
| Event rows | Select a row to open the full detail panel. |
| Actions | Clear attention only after the event has been reviewed and accepted. |
| Print the current event view when a record is needed outside the Web UI. |
Typical flow:
- Choose the time range.
- Click a severity card or apply filters.
- Select the event row.
- Review the detail panel.
- Clear attention only when the event no longer needs operator attention.
Metric Browser
Use Metric Browser when you need sampled metric history or a deeper look at collector data.
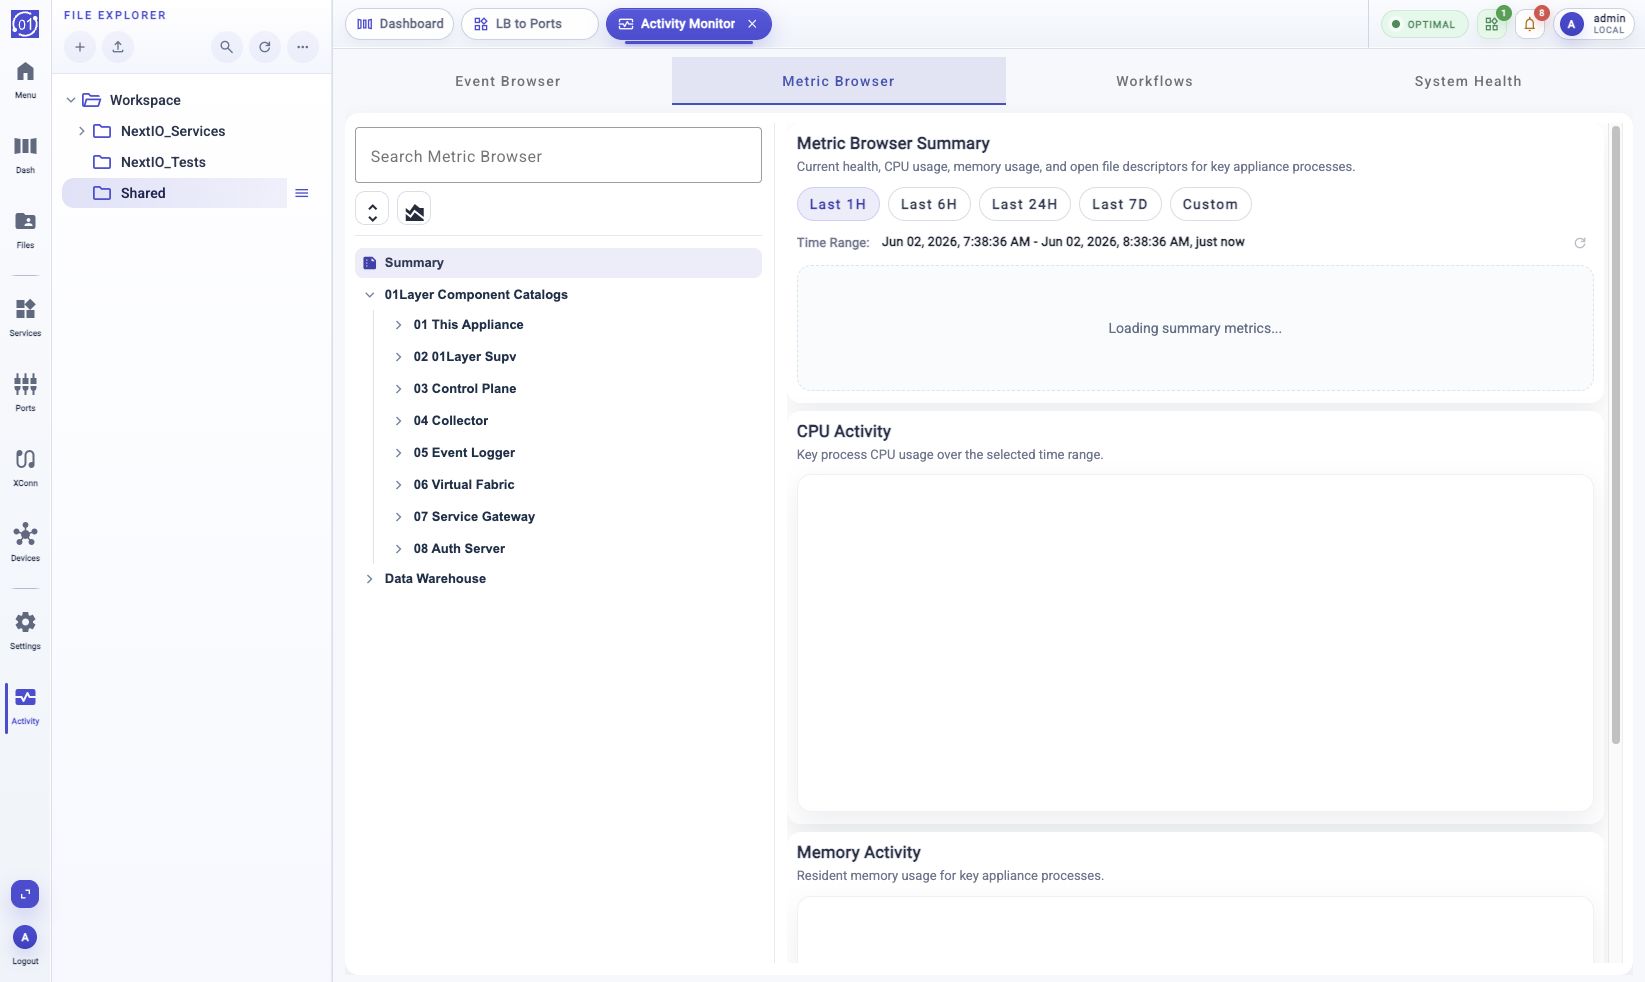
The left tree organizes metrics and collector data. The right side changes based on the selected tree node.
| Area | What to inspect |
|---|---|
| Search Metric Browser | Find loaded metric nodes, components, metric sets, or warehouse objects. Expand branches first when the metric is not yet visible. |
| Summary | Review key process health, CPU activity, and memory activity. |
| 01Layer Component Catalogs | Browse sampled metrics by reporter, entity, object, metric set, and metric. |
| Data Warehouse | Inspect collector catalog, serving database, segment metadata, schemas, and preview rows. |
| Time ranges | Choose Last 1H, Last 6H, Last 24H, Last 7D, or Custom for charts. |
| Multi-Line Plotter | Compare several metrics in one chart when a single metric does not explain the issue. |
Typical flow:
- Search or expand the metric tree.
- Select Summary for a quick health view, or select a specific metric from 01Layer Component Catalogs.
- Choose the time range.
- Review the chart, latest value, point count, unit, and source column.
- Open Multi-Line Plotter when comparing related metrics.
Workflows
Use Workflows when you need to know what task ran, who started it, whether it succeeded, and what output or trace it produced.
The Workflows tab is the audit trail for configuration and operational tasks started elsewhere in the Web UI.
| Area | What to inspect |
|---|---|
| Time range | Choose Last 1H, Last 6H, Last 24H, Last 7D, Last 30D, All Time, or Custom. |
| Counter cards | Review total, running, completed, failed, stopped, and lifecycle counts for the selected range. |
| Search | Find workflows by name, user, description, or error text. |
| Status | Filter by run status such as running, completed, failed, or stopped. |
| Lifecycle | Filter by active, archived, or deleted records when lifecycle data is available. |
| Mine only | Show workflows issued by the current user. |
| Detail panel | Review workflow ID, status, progress, user, timing, storage, last error, original configuration, and trace output when available. |
Typical flow:
- Choose the time range.
- Use a counter card or filter row to narrow the table.
- Select the workflow row.
- Review Last Error, Original Configuration, and Trace when they are present.
- Retry the original task only after correcting the input or runtime condition.
System Health
Use System Health when the issue looks broader than one event, workflow, or metric. It gives a compact view of appliance activity and collector health.
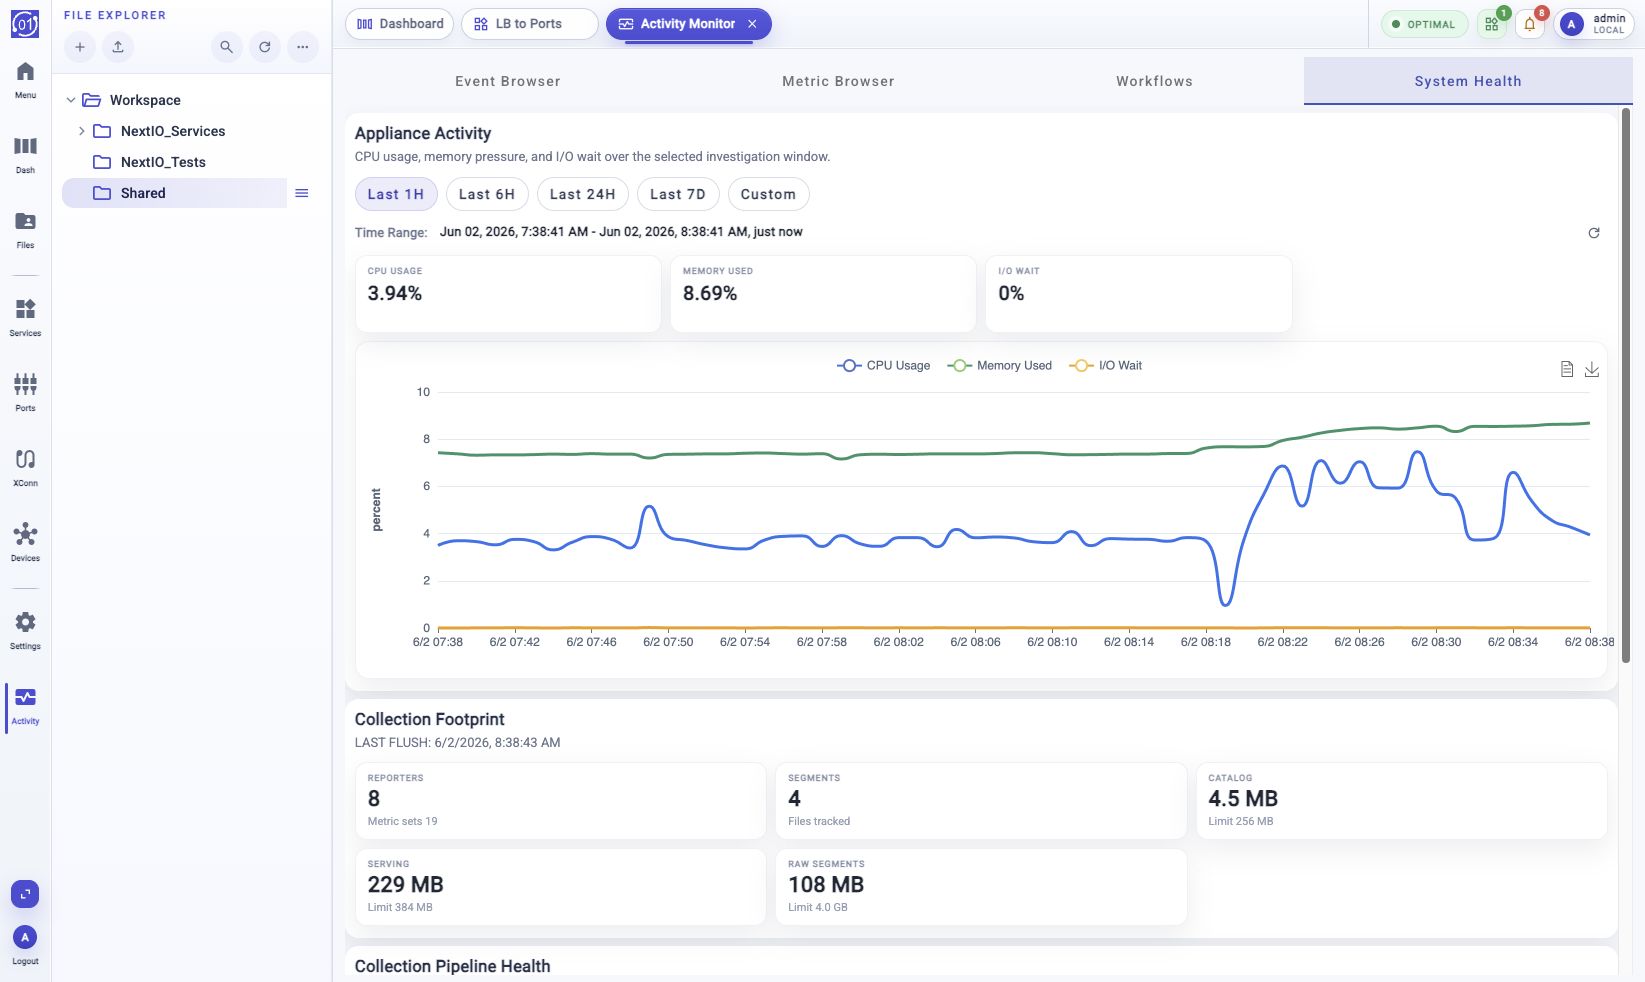
System Health summarizes current pressure and collection behavior before you open lower-level metrics.
| Area | What to inspect |
|---|---|
| Time range | Choose Last 1H, Last 6H, Last 24H, Last 7D, or Custom. |
| Appliance Activity | Review CPU Usage, Memory Used, and I/O Wait over the selected range. |
| Collection Footprint | Review reporter count, segment count, catalog storage, serving storage, and raw segment storage. |
| Collection Pipeline Health | Review append rate, write rate, ingest queue length, and related pipeline charts. |
| Refresh | Move a relative time range to the current time. |
Typical flow:
- Choose a recent time range such as Last 1H or Last 6H.
- Review appliance CPU, memory, and I/O wait.
- Review collector footprint and storage usage.
- Review pipeline rates and ingest queue depth.
- Open Metric Browser when a value needs lower-level investigation.
Shared Investigation Habits
Start with the tab that matches the first symptom, then move across tabs when the issue needs correlation.
| Symptom | Start here | Then check |
|---|---|---|
| Alert badge, warning, error, or critical event | Event Browser | System Health and Metric Browser for related health or metric history. |
| Failed configuration or operation | Workflows | Event Browser for matching errors and Metric Browser for runtime pressure. |
| Slow or unhealthy appliance behavior | System Health | Metric Browser for process and collector metrics. |
| Unknown issue during a time window | Event Browser | Workflows, then System Health and Metric Browser. |
Troubleshooting
Counts Do Not Match The Dashboard
Check the time range. Dashboard alert badges can represent retained history, while Activity Monitor tabs may open with a recent range.
Charts Are Empty
Choose a wider time range and refresh. If charts remain empty, check System Health and then inspect the related reporter in Metric Browser.
Workflow Details Are Missing
Some older or cleaned workflow records may not retain trace or original configuration artifacts. Review the available status, timing, user, and error fields.
Search Does Not Find A Metric
Expand the relevant 01Layer Component Catalogs branch first. Metric search uses loaded tree entries.
Related Tasks
- Use Event Browser for deeper event and alert procedures.
- Use Metric Browser for metric browsing and plotting.
- Use Workflows for workflow audit and trace review.
- Use System Health for appliance and collector health summaries.
- Use FlowDirector Dashboard for the first operational overview.