Overview
The System Overview card is the first health check on the FlowDirector Dashboard. Use it to confirm whether the appliance is healthy before spending time in detailed views.
Read The Card
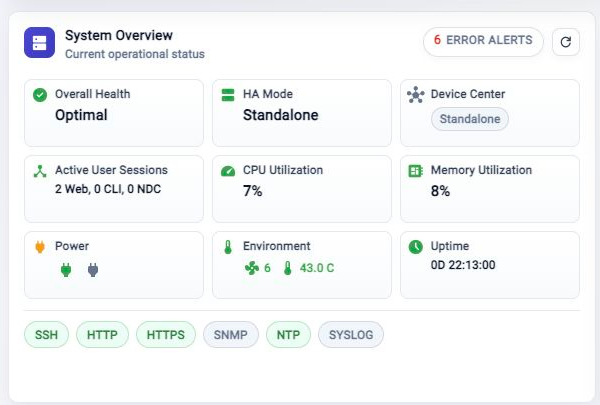
Start with Overall Health and the alert pill in the card header. If health is not optimal or the alert count is non-zero, open Event Browser for the event trail.
The card also shows:
- HA Mode and Device Center state.
- Active User Sessions across web, CLI, and Device Center access.
- CPU Utilization and Memory Utilization.
- Power and Environment state.
- Uptime since the appliance last started.
- Service chips such as SSH, HTTP, HTTPS, SNMP, NTP, and SYSLOG when service data is available.
When To Drill Down
Use Event Browser when the alert count changes or when health is not optimal. Use Activity Monitor > System Health when you need collector, resource, or health history beyond the current Dashboard snapshot.
Troubleshooting
Alert Count Looks High
Open Event Browser from the alert pill and review the current time range. The Dashboard card shows a summary; the event view gives the event details.
Resource Values Look Stale
Refresh System Overview. If the values still do not update, check Activity Monitor > System Health.
Related Tasks
- Use FlowDirector Dashboard for the full Dashboard operating view.
- Use Event Browser to investigate alert history.
- Use Activity Monitor > System Health to review appliance health history.