Overview
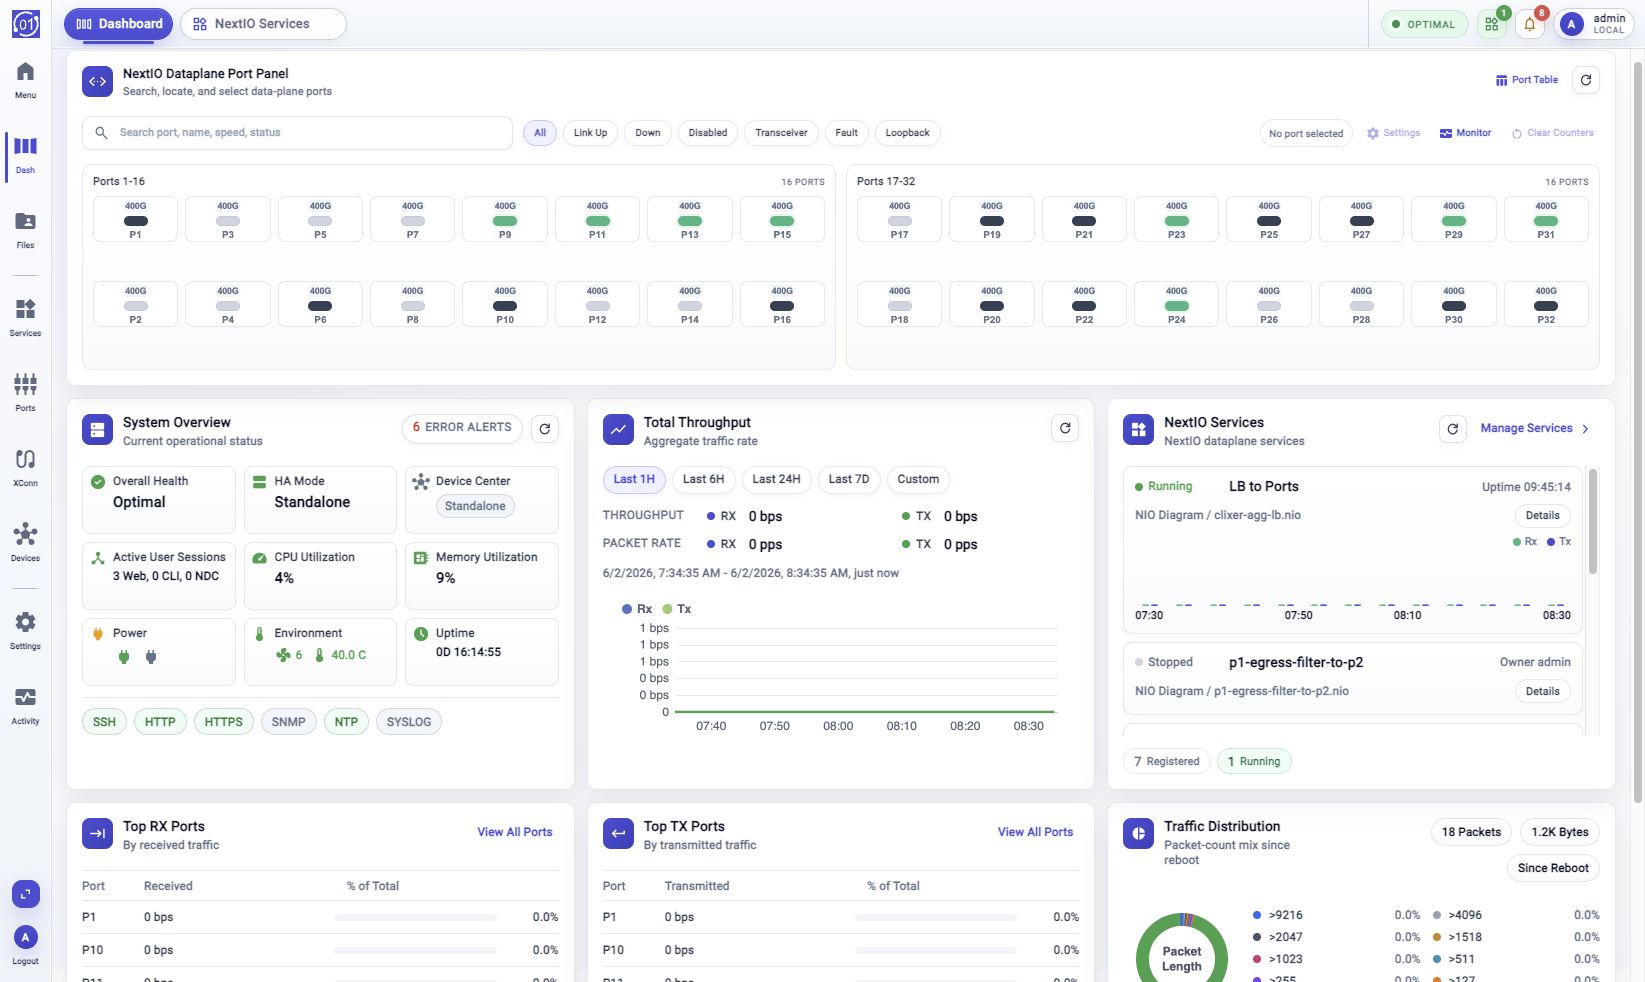
The FlowDirector Dashboard is the first operating view for a FlowDirector appliance. It brings health, dataplane ports, traffic rate, NextIO services, top ports, and traffic distribution into one page.
Use it for a quick answer to three questions:
- Is the appliance healthy?
- Are ports and services in the expected state?
- Is traffic moving where you expect it to move?
Dashboard Scan
Open Dashboard from the activity bar. Wait for the cards to finish loading, especially after reboot, when appliance status and metric samples may still be starting.
Read the page in this order:
- System Overview - confirm health, alerts, resource use, uptime, and service state.
- NextIO Dataplane Port Panel - look for down, disabled, fault, transceiver, or loopback ports.
- Total Throughput - compare RX and TX traffic rate with the recent timeline.
- NextIO Services - check whether dataplane services are registered and running.
- Top RX Ports, Top TX Ports, and Traffic Distribution - identify traffic hotspots and traffic mix.
Dashboard Cards
| Card | Use it to |
|---|---|
| System Overview | Check overall health, HA state, Device Center state, active sessions, CPU, memory, power, environment, uptime, services, and alert count. |
| NextIO Dataplane Port Panel | Scan physical port state and find ports by name, speed, link state, transceiver state, fault state, or loopback state. |
| Total Throughput | Review aggregate RX and TX bit rate, packet rate, and recent traffic trend. |
| NextIO Services | Confirm registered services, running state, owner, design file, and port usage. |
| Top RX Ports | Find the ports receiving the most traffic. |
| Top TX Ports | Find the ports transmitting the most traffic. |
| Traffic Distribution | Review packet length, traffic class, VLAN or encapsulation mix, and packet or byte totals. |
Most Dashboard cards are read-only. The buttons on the cards open focused views or workflows when the summary points to something that needs attention.
Port Panel
The NextIO Dataplane Port Panel sits at the top of the Dashboard. It is the fastest way to spot physical-port issues before opening a detailed table.
See Port Panel for tooltip behavior, single-port selection, Ctrl-click or Cmd-click multi-selection, Shift-click range selection, and built-in filter conditions.
Use Search port, name, speed, status to narrow the panel by port name, configured name, speed, or state text. Use the filter buttons to show All, Link Up, Down, Disabled, Transceiver, Fault, or Loopback ports.
Click a port to select it. Use Ctrl-click or Cmd-click to select multiple ports, and Shift-click to select a range.
Useful actions:
- Port Table opens the full port table.
- Settings opens port settings for the selected ports.
- Monitor opens port monitoring.
- Clear Counters starts the clear counters workflow for the selected ports.
- The refresh control reloads dataplane port state.
Clear Counters is an operational action. Review the workflow before starting it.
Health And Alerts
Use System Overview before drilling into detail views. The card gives a compact view of appliance health, resource pressure, power and environment state, uptime, and service status.
The alert pill in the card header opens Event Browser for the current alert count. Use it when the Dashboard shows a symptom but the card does not include the full explanation.
Traffic And Services
Use Total Throughput to check aggregate traffic. Choose Last 1H, Last 6H, Last 24H, Last 7D, or Custom. For Custom, choose Start Time and End Time, then click Apply Range.
RX and TX are shown separately. Relative ranges move forward when refreshed. A custom range stays fixed until you change it.
Use NextIO Services to confirm service state. Click a service name or Details to open the service detail view. Click Manage Services to open the NextIO service management view.
Use Top RX Ports and Top TX Ports when you need to know where the traffic is concentrated. Use Traffic Distribution when you need the packet mix rather than the port ranking.
When To Drill Down
The Dashboard is a summary page. Open a detail view when the card answers "something changed" but not "why it changed."
| If you see | Open |
|---|---|
| Alert count or unhealthy status | Event Browser |
| Missing or unusual metric samples | Metric Browser |
| A port state that needs row-level detail | Port Table or Monitor |
| A service that is stopped, degraded, or noisy | NextIO Services or service Details |
| Collector or appliance health questions | Activity Monitor > System Health |
Troubleshooting
Dashboard Does Not Show FlowDirector Cards
Confirm the appliance is a FlowDirector system and that you opened Dashboard from the activity bar. Other appliance families may use a different dashboard.
Cards Are Loading Or Unavailable
Wait for appliance status, VFabric, and metric collection to finish starting, then refresh the Dashboard. This is common shortly after reboot.
Throughput Shows n/a Or No Samples
Confirm traffic is present and metrics collection is running. Shortly after boot, the chart can stay empty until the collector records samples for the selected range.
Top Port Cards Show No Samples
Top-port cards require per-port traffic samples. If Total Throughput has samples but top ports remain empty, open Metric Browser or Port Table to check whether per-port counters are being reported.
Card Counts Do Not Match A Detail View
Refresh the Dashboard and the detail view. Also confirm the time range. Some Dashboard values are current snapshots, some are since reboot, and some use the selected throughput range.
Related Tasks
- Use Start With Activity Bar for Dashboard navigation and activity-bar behavior.
- Use Event Browser to investigate dashboard alerts.
- Use Metric Browser to inspect detailed metrics and custom charts.
- Use NextIO Services to manage dataplane services.
- Use Activity Monitor > System Health to review appliance and collector health over time.