Overview
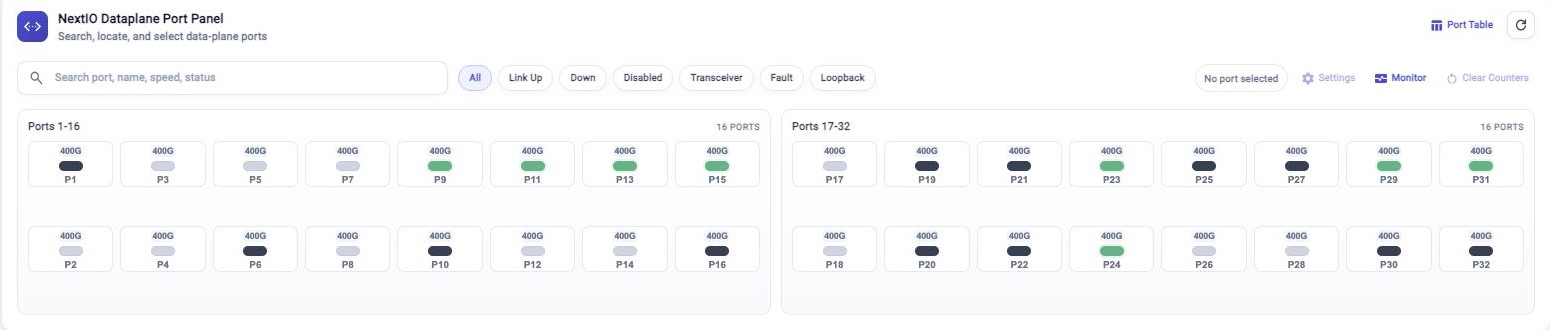
The NextIO Dataplane Port Panel gives a compact view of FlowDirector dataplane ports directly on the Dashboard. Use it to scan port state, find a specific port, select one or more ports, and open port-related actions without leaving the Dashboard first.
The panel is designed for quick inspection. Start with search or filters, then use the port tooltip and selection controls when a port needs attention.
Search And Pre-Built Conditions
Use Search port, name, speed, status when you know part of the port name, configured name, speed, or state. The panel narrows the visible port tiles as you type.
Use the pre-built search conditions when you want a ready-made view:
| Filter | Shows |
|---|---|
| All | All dataplane ports. |
| Link Up | Ports with an active link. |
| Down | Ports that are not link up and are not administratively disabled. |
| Disabled | Ports disabled by configuration. |
| Transceiver | Ports with transceiver-related state. |
| Fault | Ports reporting a fault condition. |
| Loopback | Ports with loopback enabled. |
Search text and filter chips are useful together. For example, choose Fault, then type a port name or speed to narrow the fault view.
Port Tooltip
Move the pointer over a port tile to open the port tooltip. Use the tooltip for a quick check before selecting the port or opening a detail view.
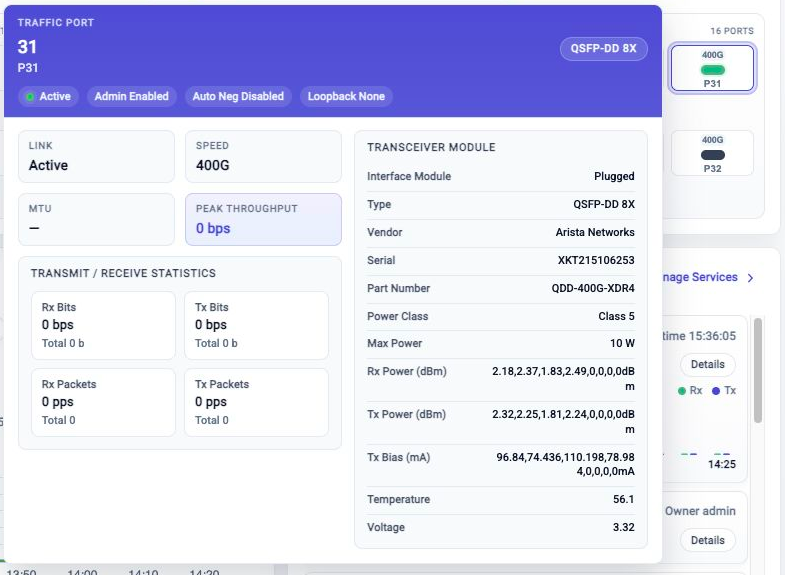
The tooltip can include port identity, speed, link state, administrative state, transceiver state, fault state, loopback state, and related breakout-port information when available.
If the tooltip does not appear, keep the pointer still over the port tile for a moment. If the page is still loading, wait for the port panel to finish loading and try again.
Select Ports
Click a port tile once to select it. The selection controls on the right side of the panel update after the selection changes.
Use these selection patterns:
| Action | Result |
|---|---|
| Single click | Selects one port. |
| Ctrl-click or Cmd-click | Adds another port to the current selection, or removes it if it is already selected. |
| Shift-click | Selects a range from the previous selected port to the port you click. |
Use range selection when ports are physically adjacent or when you need the same operation on a bank of ports. Use Ctrl-click or Cmd-click when the ports are not adjacent.
Actions After Selection
Selected ports can be used with the action buttons in the panel:
- Settings opens port settings for the selected ports.
- Monitor opens port monitoring.
- Clear Counters starts the clear counters workflow for the selected ports.
- Port Table opens the full port table.
Clear Counters changes operational counters. Review the workflow before starting it.
Some actions are disabled until a valid port selection exists.
Troubleshooting
Port Actions Are Disabled
Select one or more ports first. Some actions also depend on port state or user permission.
Shift-Click Does Not Select The Expected Range
Click the first port in the range, then Shift-click the last port. If the previous selection is not the range start you want, clear the selection and start again.
Search Or Filters Hide A Port
Clear the search field and switch the filter back to All. Then apply a more specific search or filter again.
Port Tooltip Does Not Appear
Wait for the port panel to finish loading, then move the pointer over the port tile and pause briefly.
Related Tasks
- Use FlowDirector Dashboard for the full Dashboard operating view.
- Use Metric Browser when port counters or samples need deeper inspection.
- Use Event Browser when port state is connected to alerts or events.
- Use NextIO Services when service traffic or service state needs review.