Overview
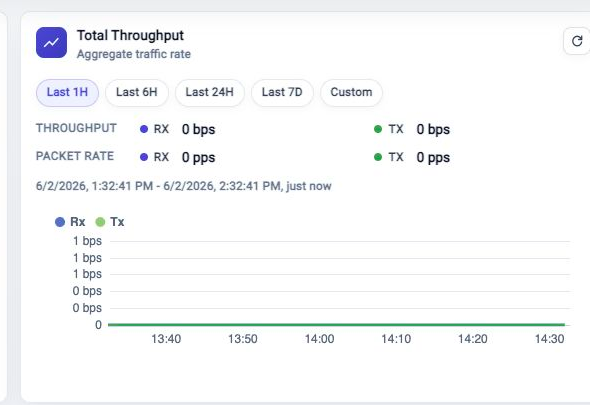
The Total Throughput card shows aggregate appliance traffic. Use it to see whether traffic is moving, whether RX and TX are balanced, and whether the recent trend changed.
Choose A Time Range
Use Last 1H, Last 6H, Last 24H, or Last 7D for a moving relative range. Use Custom when you need exact start and end times.
Relative ranges move forward when the card refreshes. A custom range stays fixed until you change it.
Read The Card
Review Throughput for RX and TX bit rate. Review Packet Rate for RX and TX packet rate. The chart shows the trend across the selected range.
Use Metric Browser when you need a custom chart, a different metric, or a longer investigation path.
Troubleshooting
Chart Shows No Samples
Confirm traffic is present and metric collection is running. Shortly after boot, the chart can remain empty until samples are collected.
Time Range Does Not Match Another View
Confirm both views use the same time range. Some Dashboard cards show current state while this card uses the selected throughput range.
Related Tasks
- Use Top RX Ports and Top TX Ports to identify the busiest ports.
- Use Metric Browser for detailed metric exploration.
- Use FlowDirector Dashboard for the full Dashboard operating view.