Overview
The Traffic Distribution card summarizes the traffic mix since reboot. Use it when you need packet composition, not just traffic rate or busiest ports.
Read The Card
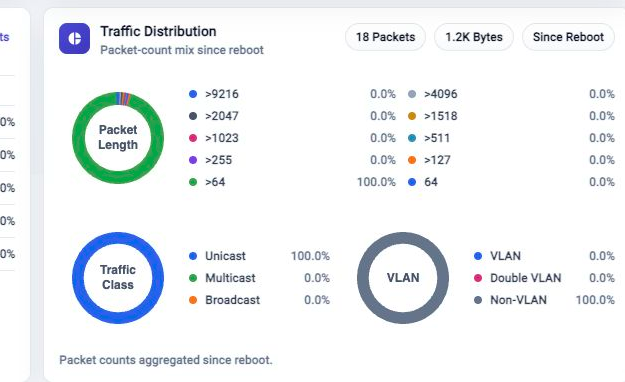
The header shows packet and byte totals. The distribution views show:
- Packet Length mix.
- Traffic Class mix, such as unicast, multicast, or broadcast.
- VLAN mix, such as VLAN, double VLAN, and non-VLAN traffic.
The card is useful for quick pattern recognition. Use Metric Browser when you need detailed samples, longer time windows, or a custom chart.
Troubleshooting
Distribution Is Empty
Confirm traffic is present and VFabric counters are available. The card can be empty shortly after boot or when the appliance has no supported distribution samples yet.
Distribution Does Not Match Throughput
Check the meaning of the time period. Traffic Distribution summarizes packet mix since reboot, while Total Throughput uses the selected time range.
Related Tasks
- Use Total Throughput to review traffic rate over time.
- Use Metric Browser for detailed metric samples.
- Use FlowDirector Dashboard for the full Dashboard operating view.