Overview
Port Table is the row-based view for FlowDirector dataplane ports. Use it when the Dashboard port panel gives you a signal, but you need sortable rows, traffic counters, transceiver information, or a port selection for actions.
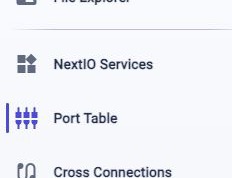
Open From Activity Bar
Click Port Table in the activity bar. In expanded mode, it appears below NextIO Services and above Cross Connections. In folded mode, use the port-table icon in the same position.
The page opens as a workspace tab, so you can return to Dashboard or another open view from the tab strip.
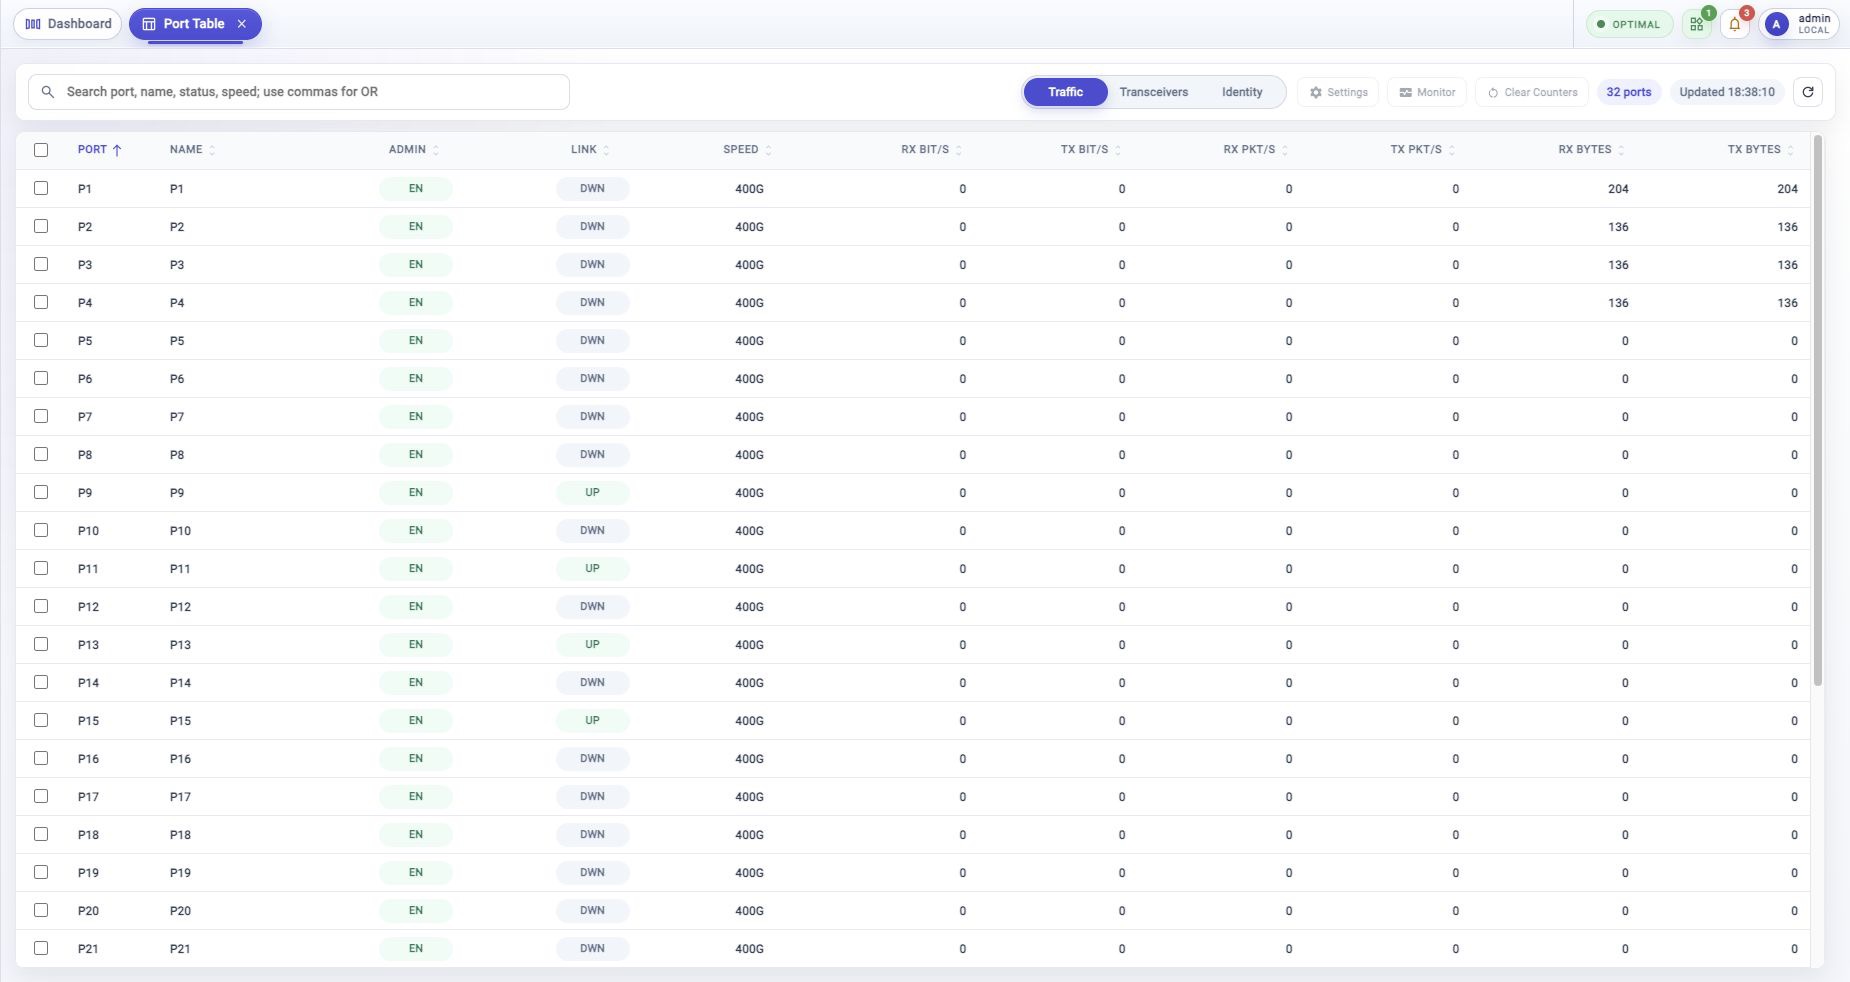
Top Toolbar
Use the top toolbar to search the table, switch the table view, run port actions, and refresh the latest port state.

Use Search port, name, status, speed; use commas for OR to narrow the table.
For example, search for a port name, UP, DWN, 400G, or a comma-separated
set of terms when you want several matches.
| Control | Function |
|---|---|
| Search port, name, status, speed | Filters the table by port, name, link state, administrative state, speed, or comma-separated terms. |
| Traffic | Link state, admin state, speed, received and transmitted rates, packet rates, and byte counters. |
| Transceivers | Module presence, power class, module type, optical power, bias, temperature, and voltage. |
| Identity | Module type, vendor, part number, serial number, power class, and maximum power. |
| Settings | Opens port settings for the selected port or ports. |
| Monitor | Opens port monitoring for the selected port or ports. |
| Clear Counters | Starts the clear counters workflow for the selected port or ports. |
| Port count | Shows how many port rows are currently visible. |
| Updated | Shows when the table last refreshed. |
| Refresh | Reloads port state, counters, and the table update time. |
Column headers can be sorted when the header shows a sort indicator. Use the port count and Updated time to confirm how many rows are visible and when the table last refreshed.
Table Views
Use the view switch to change the columns without leaving Port Table. The selected view changes what each row emphasizes.
Traffic
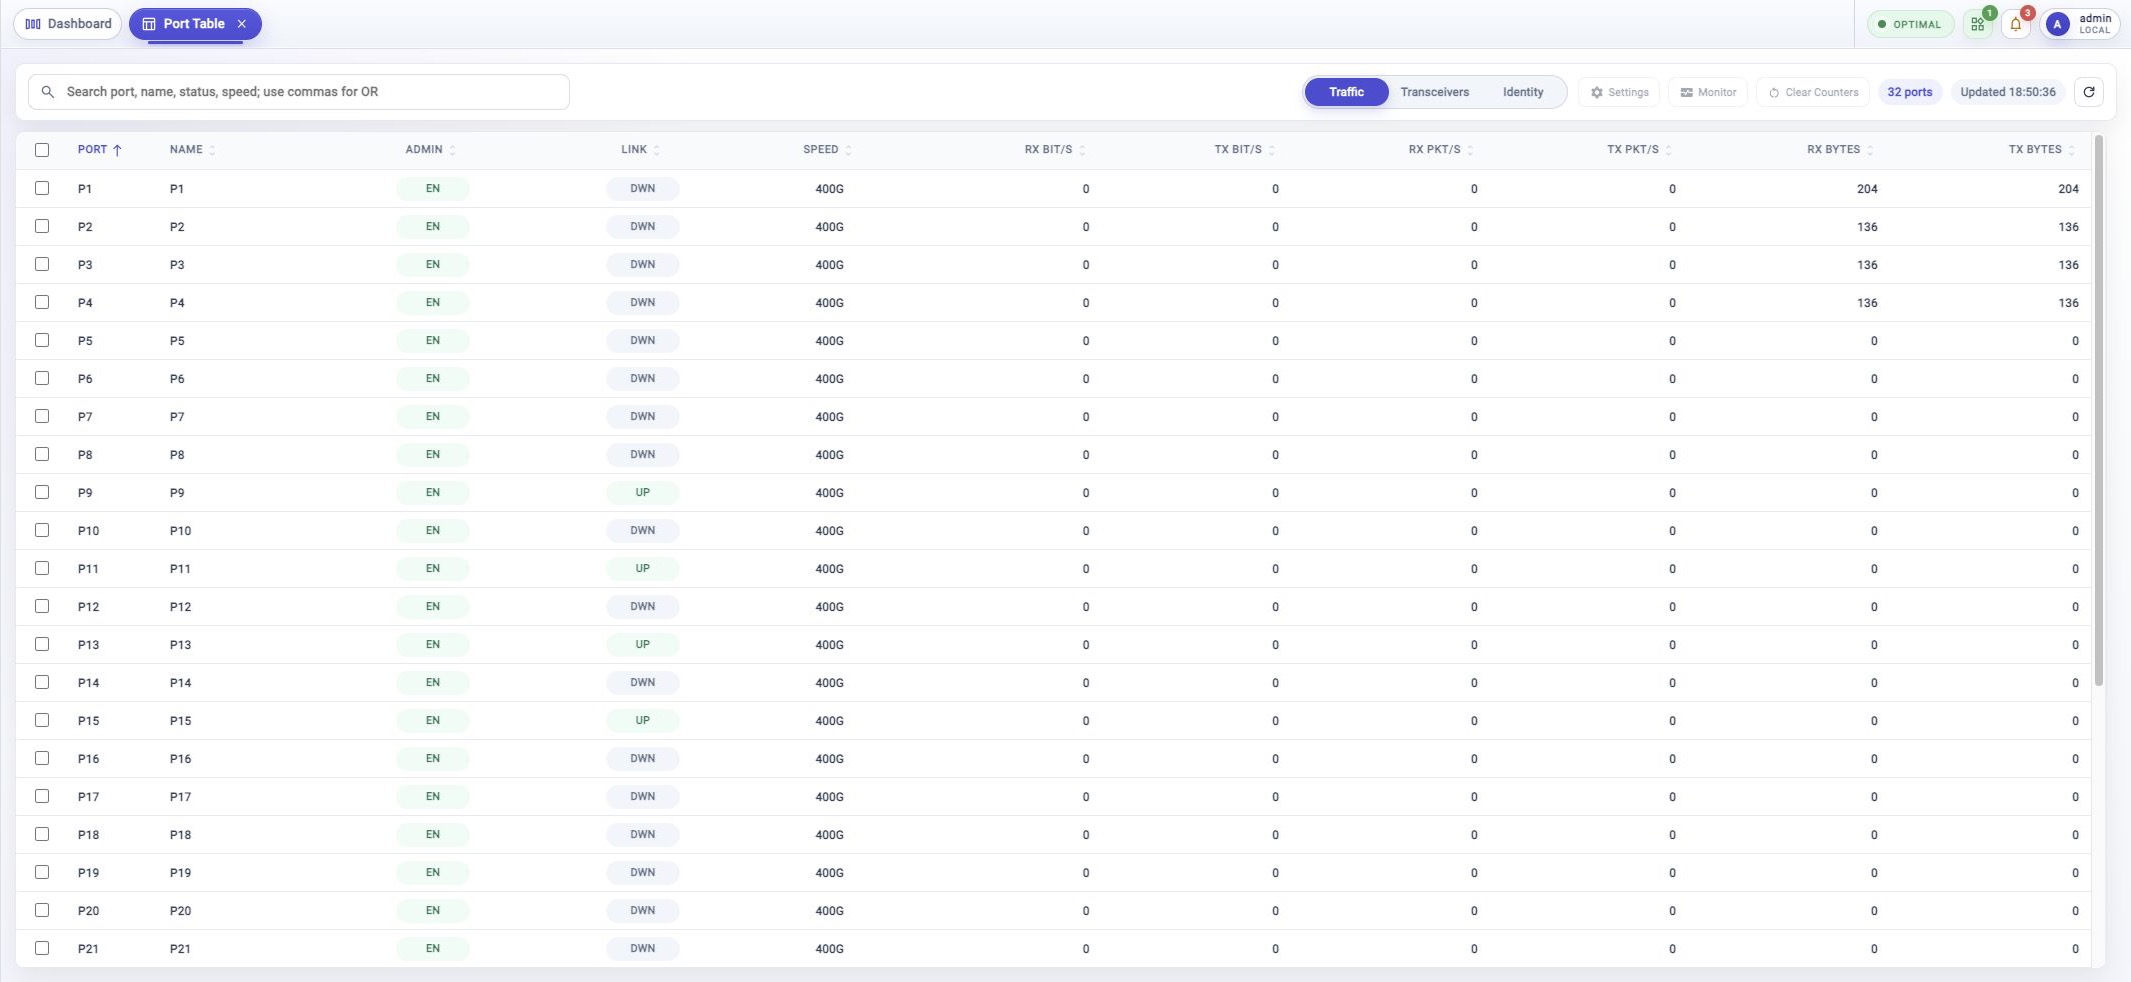
Use Traffic when you want the current operational picture. This view shows port name, administrative state, link state, speed, receive and transmit bit rates, packet rates, and byte counters.
Start here when checking whether a port is up, whether traffic is moving, or which counters changed after a test or service change.
Transceivers
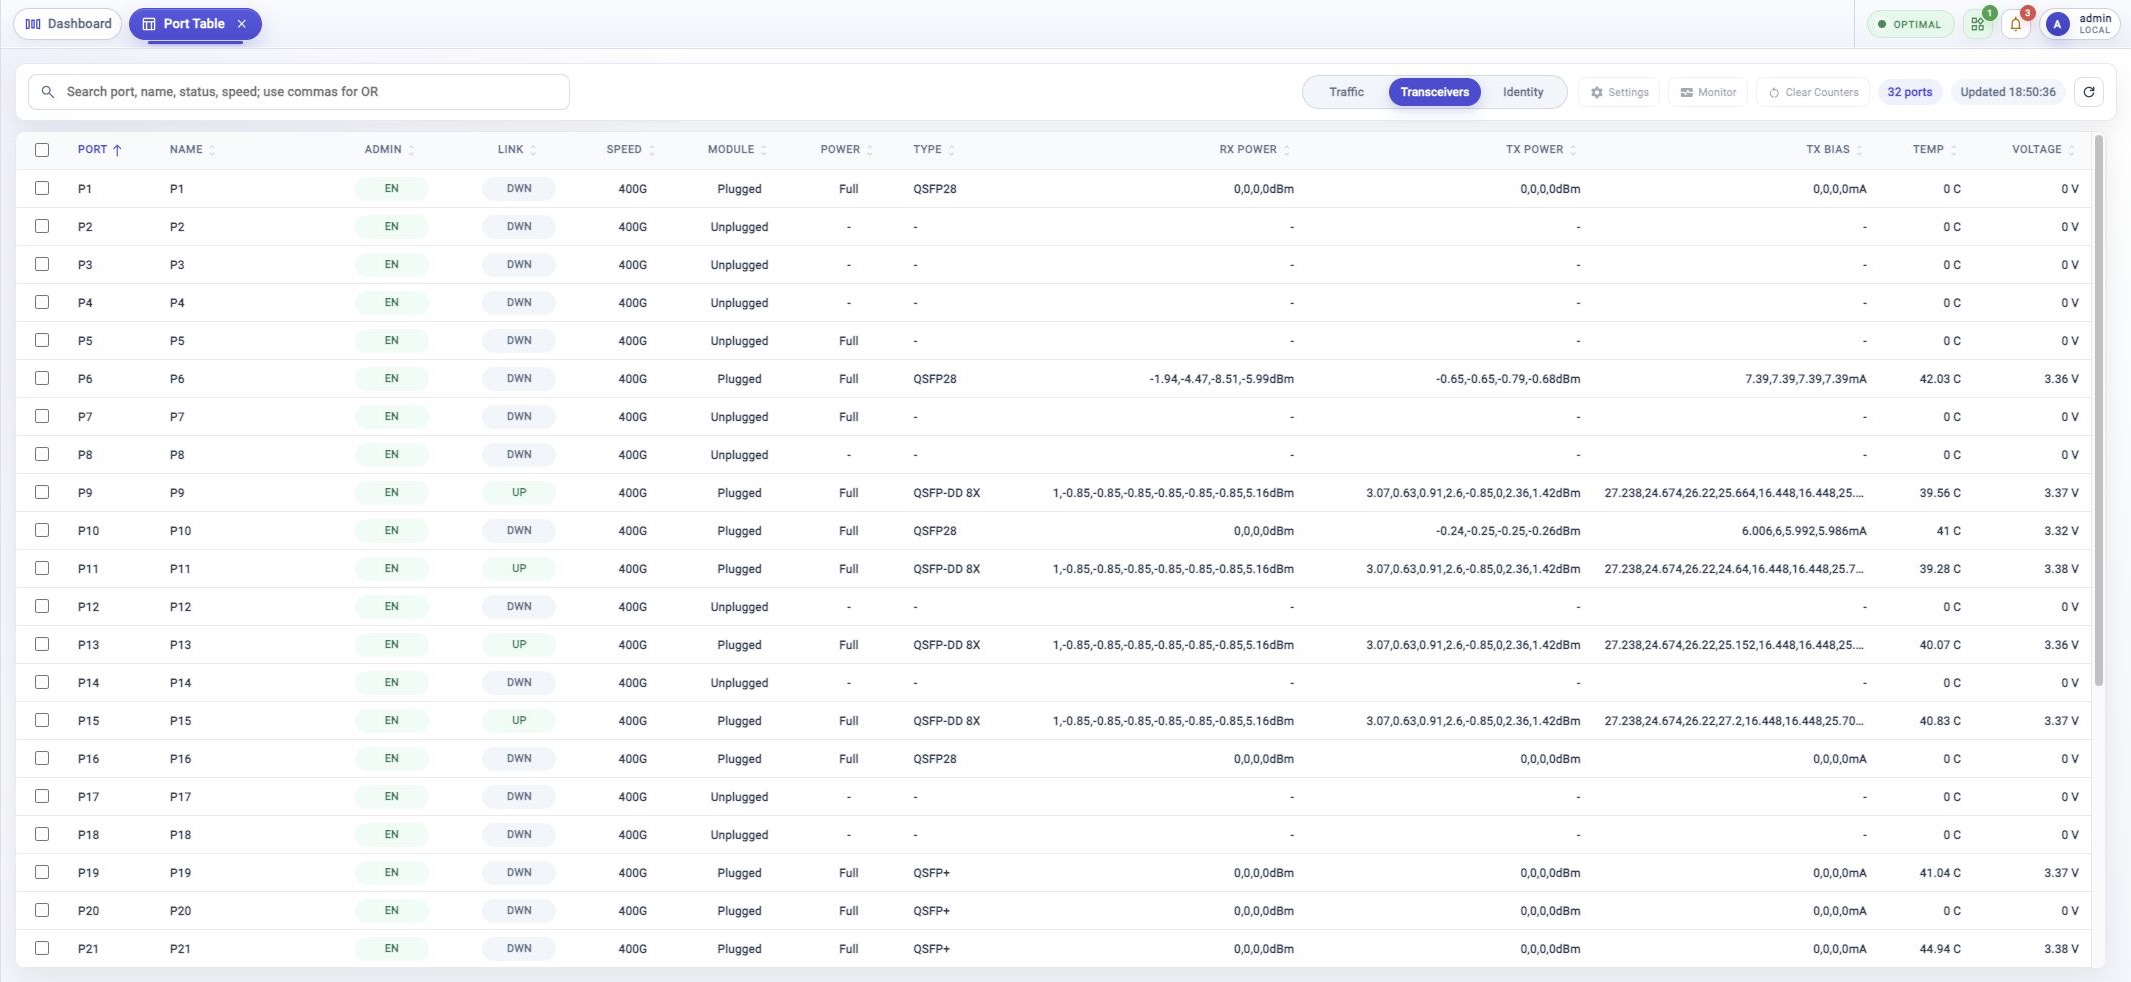
Use Transceivers when the physical module needs attention. This view shows module presence, power state, module type, receive power, transmit power, TX bias, temperature, and voltage.
Use it to compare plugged and unplugged ports, check optical power readings, or look for module health values that explain a link problem.
Identity
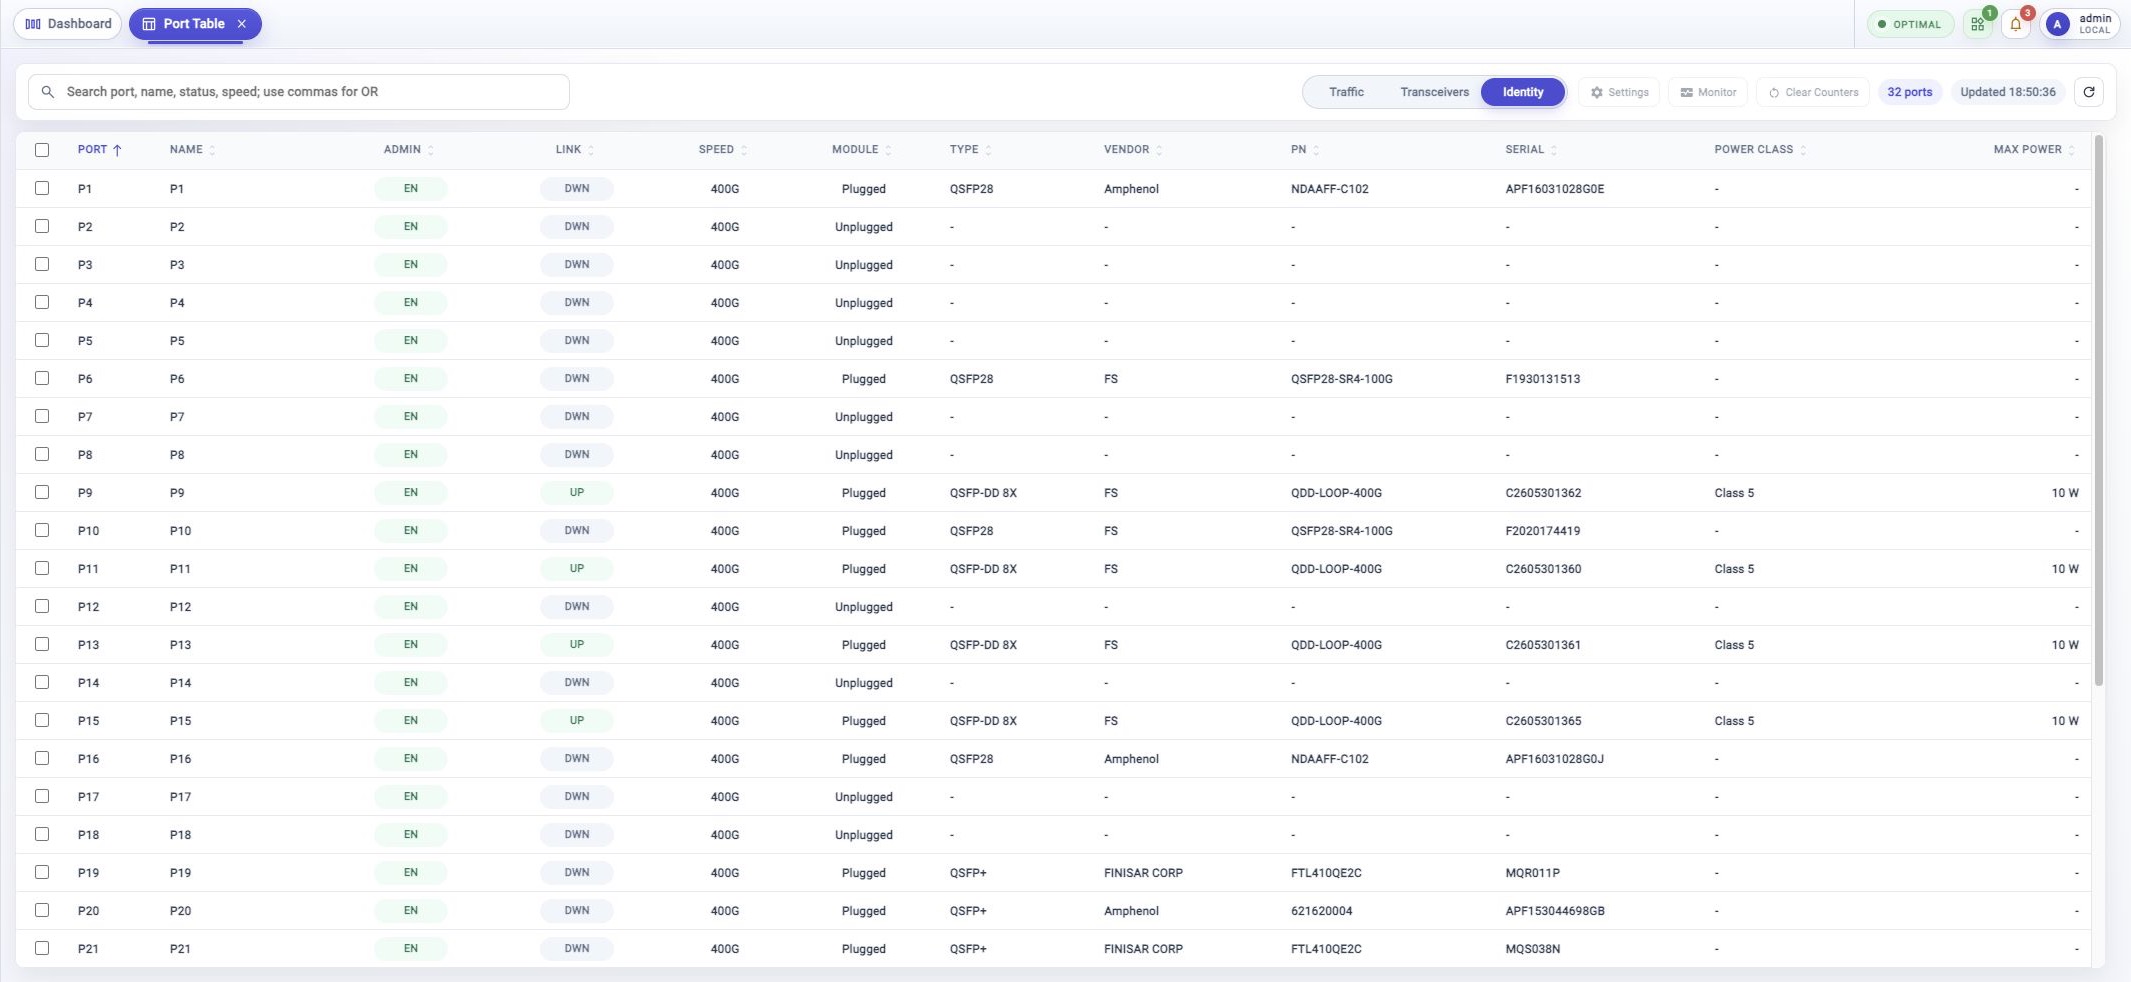
Use Identity when you need inventory or support details. This view shows module type, vendor, part number, serial number, power class, and maximum power.
Use it when confirming that the expected optics are installed or when copying module details for a support case.
Select Ports And Use Actions
Use the checkbox at the start of each row to select a port. Use the header checkbox when you want to select the visible rows.
The action buttons become available when the current selection and account permission allow the action.
Clear Counters changes operational counters. Review the workflow prompt before starting it.
Troubleshooting
Port Table Is Not Visible
Port Table appears on supported FlowDirector systems and can depend on model, license, role, or account permission.
Actions Are Disabled
Select one or more port rows first. If an action is still disabled, the current account may not have permission or the selected port state may not support that action.
Search Hides A Port
Clear the search field and refresh the table. Then search again with a simpler term such as the port number, link state, or speed.
Values Look Stale
Click Refresh. If the table still does not update, check **Activity Monitor
System Health** for collector or service health.
Related Tasks
- Use Port Panel for a compact Dashboard view with port tiles and tooltips.
- Use Metric Browser when port counters or samples need deeper inspection.
- Use Event Browser when port state is connected to alerts or events.
- Use System Settings for port configuration workflows when available.