Overview
The Top RX Ports card ranks ports by received traffic. Use it when total throughput changed and you need to know which input ports are contributing.
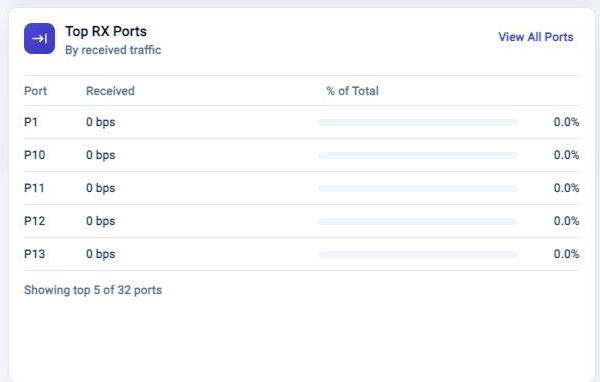
Read The Card
The card lists the busiest receive ports and shows each port's percentage of total RX traffic. A high percentage on one port means received traffic is concentrated there.
Click View All Ports when you need the full port list rather than the top five.
Troubleshooting
No RX Samples Appear
Confirm traffic is present and that per-port samples are being collected. Use Metric Browser if the Dashboard summary does not explain the missing data.
Top RX Does Not Match Total Throughput
Refresh the Dashboard and confirm the time range. Total throughput and top-port rankings can update at different moments.
Related Tasks
- Use Total Throughput to compare aggregate RX and TX traffic.
- Use Top TX Ports to compare transmitted traffic.
- Use Metric Browser for detailed port counters.