Overview
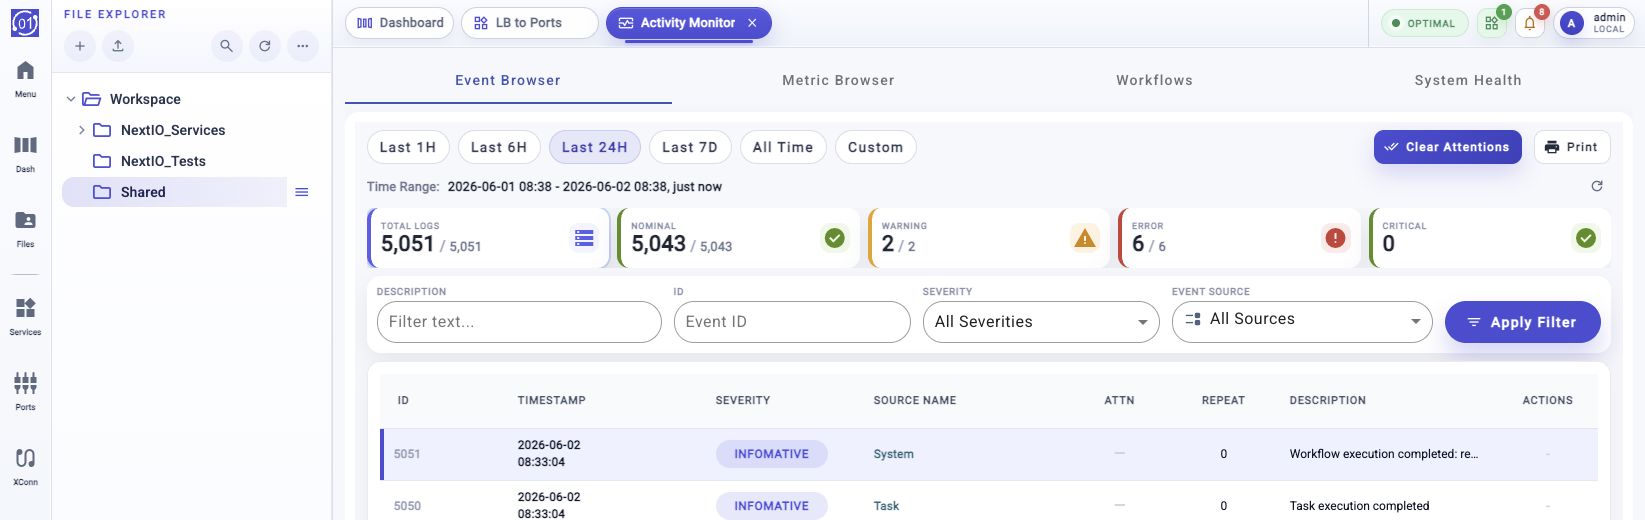
Use Event Browser to review appliance event logs from the web UI. The page shows event counts, searchable event rows, attention state, row details, and actions such as clearing actionable alerts.
Typical Uses
Common tasks include:
- Investigate a warning, error, or critical alert.
- Compare recent event activity with all-time event history.
- Search for events by ID, description, source, or severity.
- Review event details before clearing attention.
- Print the current event view when needed.
- Clear attention flags without deleting event records.
Prerequisites
- Log in with an account that has permission to view event logs.
- Confirm the time range you need before comparing counts.
- Use All Time when investigating a count opened from the dashboard alert badge. The dashboard alert badge is based on full retained event history, not only the last 24 hours.
- Use Last 24H for routine recent-event review.
- Clear alert attention only after the event has been reviewed and the operator accepts that it no longer needs attention.
Workflow
- Open Activity Monitor.
- Select Event Browser.
- Choose the required time range: Last 1H, Last 6H, Last 24H, Last 7D, All Time, or Custom.
- Use the summary cards or filter fields to narrow the event list.
- Select an event row to open the detail panel and inspect the full record.
- Use Clear Attention for one event, or Clear Attentions for the current time range and filter selection, after the events have been reviewed.
Expected Behavior
When opened directly, Event Browser defaults to Last 24H. This keeps the initial table focused on recent event activity.
When opened from the dashboard System Overview alert badge, Event Browser should open with the matching severity and All Time selected. This keeps the drill-down count consistent with the dashboard badge count.
The event table should keep the Actions column visible. Long descriptions are shortened with an ellipsis in the table row. Select a row when the full description, notes, or user actions are needed.
The Warning, Error, and Critical summary cards count only events that still require attention. When there are no uncleared events for one of those severities, the card displays a green check indicator instead of an attention icon.
Procedure
Open Event Browser
- Open Activity Monitor from the main UI.
- Select the Event Browser tab.
- Wait for the event summary cards and table to load.
You can also open Event Browser by clicking the alert badge in the dashboard System Overview card. That path opens the Event Browser with a preselected severity and All Time time range.
Choose A Time Range
Use the time range toolbar to control the event window:
- Click Last 1H, Last 6H, Last 24H, Last 7D, or All Time.
- Review the Time Range display below the toolbar.
- Click the refresh control when using a relative time range and you want the range to end at the current time.
Use Custom when you need an exact start and end time:
- Click Custom.
- Choose Start Time and End Time.
- Use the quick-adjust buttons when you need a fixed interval from the chosen endpoint.
- Click Apply Range.
Use Summary Cards
The summary cards show event counts for the selected time range:
- Total Logs
- Nominal
- Warning
- Error
- Critical
Click a summary card to apply the matching severity filter. When a time range other than All Time is selected, the card may also show an all-time total beside the selected-range count.
For Warning, Error, and Critical, the count is an unresolved attention count. Cleared events remain in the event history, but they are not included in those alert-pressure counts.
Filter Event Rows
Use the filter panel to narrow the table:
- Enter a description search string when looking for text in the event description.
- Enter an event ID when looking for a specific event.
- Choose a severity from the severity selector.
- Choose a source from the source selector.
- Apply the filter.
Clear individual filter fields when you want to widen the search again.
Inspect Event Details
- Select the event row.
- Review the detail panel that opens on the right side of the table.
- Review the detailed event fields, including ID, severity, source, timestamp, description, and notes when present.
- Use the detail panel actions when an event needs operator action.
Clear Attention
Some warning, error, or critical events require operator attention. Those rows show an active attention indicator and may provide Clear Attention in the Actions column or detail panel.
- Select the event row and review the detail panel.
- Confirm that the event condition has been handled or accepted.
- Click Clear Attention.
- Refresh the view or summary cards if you need to confirm the updated count.
Clear Multiple Attentions
Use Clear Attentions when all events matching the current time range and filter selection have been reviewed. This action opens a workflow before changes are applied, so the bulk operation is auditable.
- Choose the time range.
- Apply severity, source, event ID, or description filters as needed.
- Click Clear Attentions.
- Review the workflow confirmation.
- Start the workflow to clear attention flags for matching events.
The workflow clears only attention flags. It does not delete event records. Events that were already cleared are not counted as unresolved warning, error, or critical attention after the workflow completes.
Field Reference
| Element | Description |
|---|---|
| Last 1H | Show events from the last one hour. |
| Last 6H | Show events from the last six hours. |
| Last 24H | Show events from the last 24 hours. This is the direct-open default. |
| Last 7D | Show events from the last seven days. |
| All Time | Show events from the full retained event history. Use this for dashboard alert badge drill-downs. |
| Custom | Select an exact start and end time. |
| Description | Search event description text. |
| Event ID | Search for a specific event log ID. |
| Severity | Filter by nominal, warning, error, critical, or related severity groups. |
| Source | Filter by the component or service that generated the event. |
| Row selection | Open the right-side detail panel for the selected event. |
| Actions | Per-row actions such as clearing attention. |
| Clear Attention | Mark an actionable event as reviewed. |
| Clear Attentions | Open an auditable workflow that marks actionable events in the current time range and filter as reviewed. |
| Print the current event browser view. |
Dashboard Alert Drill-Down
The dashboard System Overview alert badge is intended to show unresolved alert pressure from retained event history. Because that badge is not limited to the last 24 hours, clicking it must preserve the same scope in Event Browser.
Expected drill-down behavior:
- The Activity Monitor view opens.
- The Event Browser tab is selected.
- The severity filter matches the badge, such as Error.
- The time range is All Time.
- The displayed unresolved attention count can be compared with the dashboard alert count.
If the page opens with Last 24H, the Event Browser count may be lower than the dashboard count because the two views are using different time windows.
Notes
- The table row description is intentionally shortened to keep the Actions column visible. Select the row and use the detail panel for the full text.
- Relative time ranges are resolved when filters are applied. Refresh the range when you need the window to end at the current time.
- All Time does not use a refresh action because it does not have a moving start or end timestamp.
- Summary cards are filters as well as indicators. Clicking a card changes the severity filter.
- Event attention state is separate from severity. An error can be present in history and still be cleared if an operator has already acknowledged it.
- Bulk Clear Attentions uses a workflow. This provides confirmation, runtime logs, and an audit trail for the selected time range and filters.
Troubleshooting
Dashboard Count Does Not Match Event Browser
Check the selected time range. The dashboard alert badge uses full retained history, while the Event Browser direct-open default is Last 24H. Select All Time when comparing against the dashboard badge.
Actions Column Is Not Visible
Refresh the page after upgrading to a build that contains the fixed event table layout. Long descriptions should be truncated in the row and the Actions column should remain visible.
Description Is Shortened
This is expected in the table view. Select the row and review the detail panel for the full event description and notes.
Clear Attention Is Disabled
The event may not require attention, or it may already be cleared. Review the attention icon and event details before retrying.
Clear Attentions Clears More Than Expected
Review the active time range and filter panel before starting the workflow. The bulk workflow uses the current Event Browser selection, including time range, severity, source, event ID, and description filters.
No Events Are Displayed
Clear filters, choose All Time, and refresh the view. If the table is still empty, confirm that event logging services are running and that the selected source or severity is valid.
Related Tasks
- Use Dashboard > System Overview to identify the highest-severity active alert count.
- Use Activity Monitor > Metric Browser when an event needs correlation with system or dataplane metrics.
- Use system workflows or CLI commands to resolve the condition that generated the event before clearing attention.