
Observe
Bring the evidence together
Combine continuing capture with PCAP or PCAPng intake. Use source groups and time windows to keep the investigation focused on the service and site involved.
Joint capture and PCAP analysisAPM / Application Performance Monitoring
Bring application context to a network investigation. 01Layer combines live traffic, uploaded captures, protocol metadata, and QoS analysis so teams can examine service behavior and test the effect of a change.
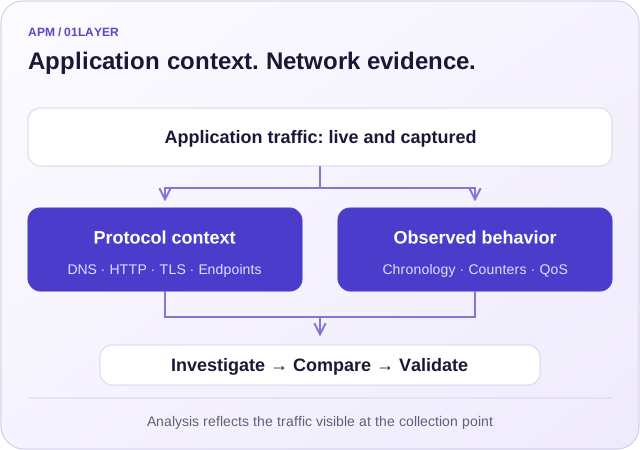
Review supported protocol activity and the endpoints involved.
Focus the time window and examine the supporting traffic evidence.
Compare observed behavior using repeatable analysis and validation.
The network view of the application
The workflow starts with traffic evidence: current site capture, files uploaded by a remote team, or a monitored folder. Apply consistent targeting and analysis across these sources.
Observe
Combine continuing capture with PCAP or PCAPng intake. Use source groups and time windows to keep the investigation focused on the service and site involved.
Joint capture and PCAP analysisUnderstand
Explore supported DNS, HTTP, TLS, email, and other protocol profiles alongside endpoint, session, network, and QoS context.
Metadata capabilityValidate
Use captured, replayed, or generated traffic with timing and counters to review service treatment and the effect of a configuration change.
QoS AnalysisProtocol-level evidence
Start with the protocols and endpoints involved in the application path. Select the profiles that match the question and use retained capture evidence for closer inspection.
| View | What it contributes | How to use it |
|---|---|---|
| DNS | Name queries, responses, latency, response codes, and resource-record context. | Examine name-service activity in the incident window and relate it to the affected endpoints. |
| HTTP and TLS | HTTP method, host, URI, client and server addresses; TLS version, cipher, server name, resumption status, and alert fields. | Identify the observed service and inspect the connections associated with the report. |
| Sessions and endpoints | Endpoints, service, session duration, byte counts, connection state, and missed-byte signals. | Narrow the traffic to the client, server, site, or capture source involved. |
| QoS and traffic timing | Counters, timing, and observed traffic treatment. | Compare the traffic behavior before and after a change or under a chosen workload. |
| Supporting protocols | Supported email, FTP, QUIC, SSH, RDP, and file-transfer profiles. | Inspect the protocol context relevant to the service being investigated. |
This workflow provides the application view available from network traffic. The visibility depends on the collection point, retained data, and exposed protocol fields; encrypted content requires its own access and analysis context.
Inside the analysis workflow
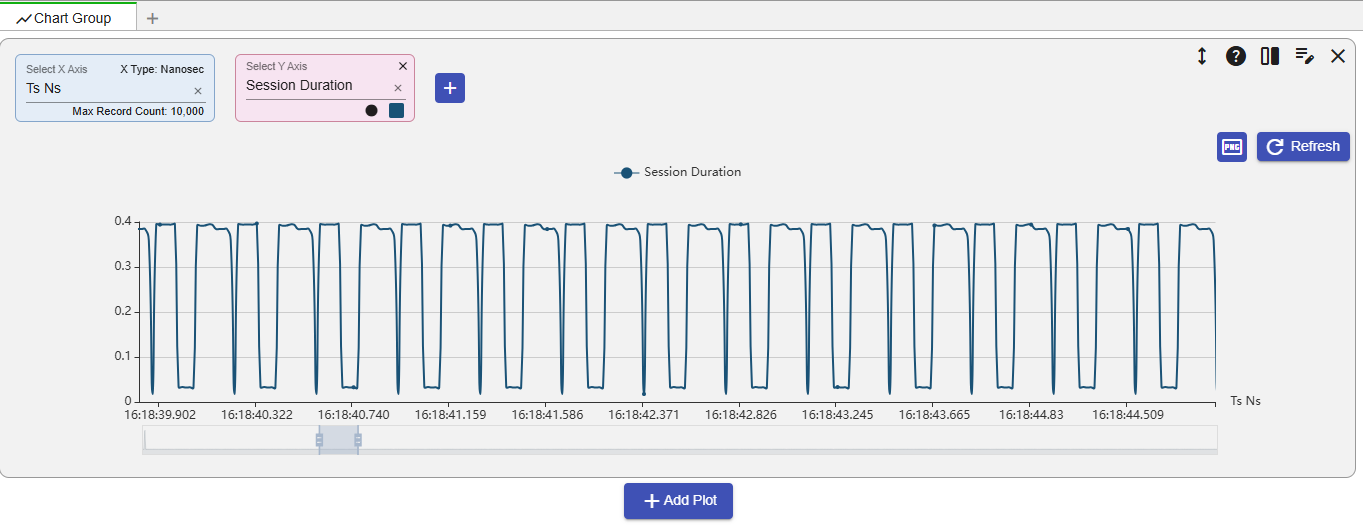
HTTP records expose the method, host, URI, endpoints, and transaction depth. Session and connection views add duration, byte counts, connection state, and missed-byte signals to help identify resets, unstable flows, or performance outliers.

From symptom to evidence
Use one scope for the reported symptom, the selected traffic, and the findings shared between teams.
Record the affected application, endpoints, site, and incident interval. Select the live source or uploaded evidence that covers that observation.
Apply IP, IP-list, IP-range, BPF, or regular-expression targeting as appropriate. Merge capture timestamps when multiple sources need a common chronology.
Inspect supported protocol profiles, session and endpoint context, traffic timing, and QoS evidence. Return to the selected trace when a detail needs verification.
Use analytic tables, dashboards, or a notebook to retain the method, source scope, and findings. Export the relevant trace or dataset for the next team.
Test the next decision
When a network or service change is proposed, use a reproducible workload and a defined observation window to assess the result.
Use captured traffic with Packet Replay, or select the documented stateless generation and application-simulation tools when a controlled workload is needed.
Choose rate, duration, and workload profile to represent the condition being examined, then collect the resulting traffic for comparison.
Validation toolsQoS Analysis combines generated, replayed, or captured traffic with timing and counters. Review the service behavior against the intended treatment.
Use a notebook when the comparison needs a repeatable custom analysis, visualization, or report beyond a fixed view.
QoS analysis workflowOperational practice
Collection and retention choices determine which application questions can be investigated later.
Keep exploring
Open the function descriptions, component controls, and related workflows behind this capability.
Discuss the sources, service requirements, and deployment that fit your operation.