
Network context
Identify the communication
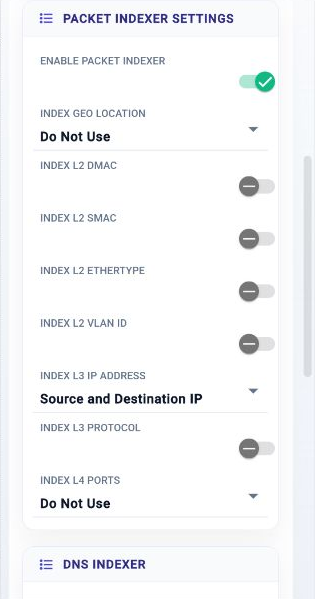
Index MAC addresses, EtherType, VLAN, IP addresses, IP protocol, transport ports, and optional geolocation context from IP.
Metadata componentMetadata / Context and discovery
Find the connections, protocols, and application context that explain an event. 01Layer extracts information from captured traffic and brings live and uploaded evidence into searchable views, analytic tables, and notebooks.
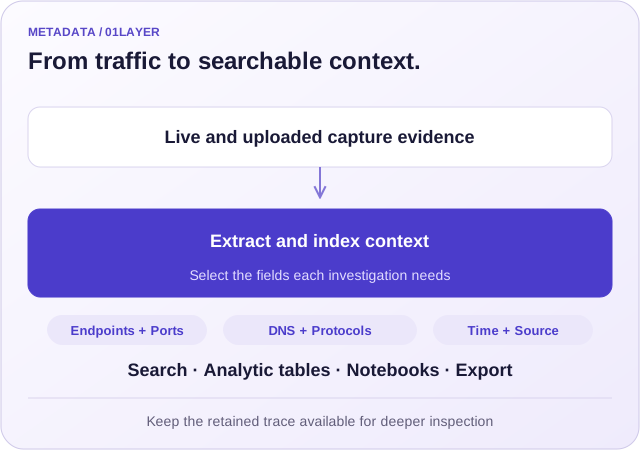
Index the addresses, ports, protocols, and DNS fields you need.
Profile supported application and network metadata.
Use analytic tables, notebooks, dashboards, and exports.
Layers of context
Metadata makes selected facts from traffic easier to find and compare. The capture workflow provides both configurable packet and DNS indexing and broader protocol profiling in the joint analysis environment.
Network context
Index MAC addresses, EtherType, VLAN, IP addresses, IP protocol, transport ports, and optional geolocation context from IP.
Metadata componentDNS context
Select query/response, opcode, response code, and resource-record type, name, or value indexes to support DNS-focused investigation.
DNS index controlsProtocol context
Use supported DNS, HTTP, TLS, email, NetFlow, FTP, QUIC, SSH, RDP, and file-transfer views in the Joint Realtime and PCAP Analysis workflow.
Protocol analysis workflowTargeted indexing
The Metadata component exposes independent packet and DNS indexer settings. Select useful dimensions for the traffic being retained and allocate the processing resources for that service.
The component index controls and the broader protocol-analysis views serve different parts of the workflow. Select both according to the investigation, source traffic, and retained evidence.
DNS data mining
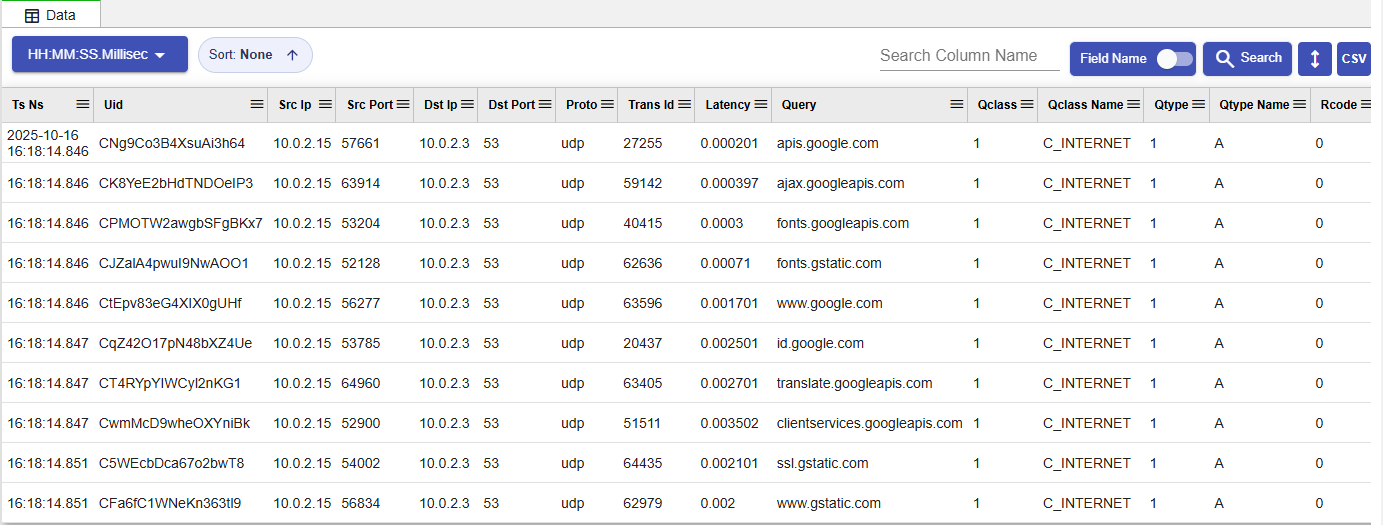
The DNS analysis view presents timestamp, endpoints, latency, query name, query type, and response code as searchable records. Filter, sort, and export the selected observations, then return to the traffic evidence when a response needs closer inspection.
Shared analysis environment
Live capture and uploaded PCAP evidence can share tables, timelines, dashboards, notebooks, and exports. This brings the same targeting and context to a continuing site feed and a trace collected elsewhere.
The joint workflow extracts packet, session, network, and application fields into an analytic database. Select the protocol views and enrichment layers needed for the investigation.
Scope sources by business unit, site, collection source, or case. Set predictable extraction locations when files, documents, emails, or attachments are part of the supported analysis.
Use a notebook to combine processing, visualizations, findings, and notes in one record. Reuse the same procedure when a new capture arrives or a condition returns.
Export the relevant data and preserve the source and time range with the result. Keep the raw capture available when a finding requires closer inspection.
Notebook workflowPractical investigation
Use the context visible in the selected traffic to narrow the investigation and decide where detailed evidence is needed.
| Question | Useful context | Next step |
|---|---|---|
| Who communicated with this endpoint? | Source and destination addresses, transport ports, time window, and source group. | Select the relevant sessions and inspect the retained trace. |
| Which names appeared during the event? | DNS query/response, response codes, resource-record names and values. | Compare name activity with the corresponding endpoint and time window. |
| What application context stands out? | Available domains, certificates, user agents, protocols, and file-transfer context. | Review the relevant protocol profile and supporting capture evidence. |
| Does a remote capture match current conditions? | Uploaded and live-source views using consistent targeting and time context. | Compare the selected datasets in dashboards, analytic tables, or a notebook. |
Protocol metadata depends on what the traffic exposes. Encrypted payload content is not implied by the availability of TLS, certificate, or other visible connection metadata.
From collection to context
A focused configuration makes the resulting dataset more useful to the operators who will rely on it.
Choose live traffic, uploaded files, or a monitored folder. Use timestamp merge when multiple captures must be reviewed chronologically.
Set the time, IP, BPF, or other supported targeting criteria. Choose the packet, DNS, and protocol fields needed for the question.
Set metadata review and raw-packet retrieval windows. Assign source groups and extraction folders to preserve investigation scope.
Check the generated fields against representative traffic, then use tables, dashboards, notebooks, and exports to document the findings.
Keep exploring
Open the function descriptions, component controls, and related workflows behind this capability.
Discuss the sources, service requirements, and deployment that fit your operation.